


Mapping data using visualization tools is a powerful way to engage your audience. Today’s announcement by the Toronto Police of a crime-mapping tool is a great example of an interactive, online map to further engage the public. Crime-mapping tools can help solve major crimes by being able to visualize data on a map. Here’s a snippet of the story:
“The set of tools provides interactive mapping of crime information that will give the public up-to-date locations of what’s been happening in their communities,” Ian Williams, acting manager of business intelligence and analytics, said in a release.
Data growth is set to continue at a fast rate, with data growing in volume, breadth, and complexity.
Many datasets within our enterprises are capable of being mapped, but accurate geocoding, datasets and easy to use visualization tools are the key.
Did you know that DMTI Spatial provides options? Our datasets cover over 97% of Canadian addresses. We update over 2,100 postal codes and 2,300 municipalities across Canada in the last 3 months alone. And this data is available for use in mapping apps as well. Our API brings high precision geocoding and address points directly into your customer solutions.
Are you struggling to implement data visualization? What challenges do you run up against in engaging your audience through mapping technologies? Click here to learn how DMTI Spatial can help.

In an increasingly digitized world, data carries undeniable clout. At once the source of insight into optimizing business operations, data analytics also supports the development of products and services that were unimagined before as new sources of social and sensor information – and the technology to manage it – come online.
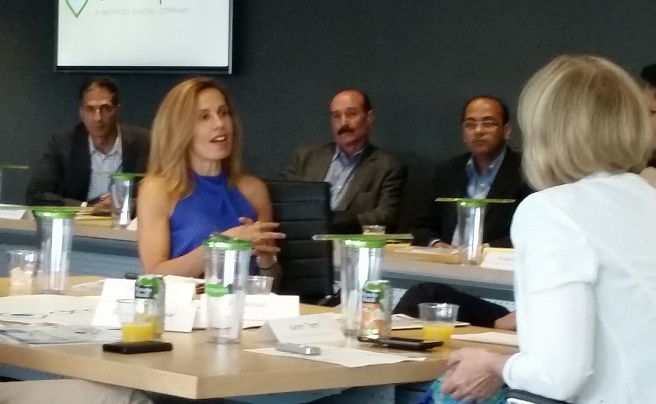
But if the vision for data potential is coming into sharper focus, for many organizations, the actual integration of new volumes and variety of data to create business value is less clear. In this situation, the sharing of experiences with data successes and ongoing challenge can serve as a useful tool to galvanize discussion and ultimately more successful deployment of data and analytics solutions. Within a specific industry, this sharing can take on added import as common language and circumstance create quick sympathy – a phenomenon demonstrated in the June installment of DMTI Spatial’s Strategic Insights Sessions, at which key players in the financial sector considered top of mind issues in the use of analytics in banking and insurance.
To kick off this month’s pre-game session at the Rogers Centre in Toronto, DMTI invited four panelists to outline their involvement with different analytics projects. These presentations provided a springboard for session attendees to discuss their own knowledge and experience of data practices. Like the topics covered in the panel presentations, conversation in post-panel breakout sessions was animated and broadly based. Several key themes arose in the panel, breakouts and Q&A segments, however, that reveal much about the current state of data analytics adoption.
In her presentation, Susan Doniz, global chief information officer for provider of marketing and loyalty analytics solutions Aimia, lead with the notion of ‘customer experience’, a buzz topic in the industry that is an increasing preoccupation of customer facing organizations that are on the cutting edge of service delivery.
According to Doniz, loyalty programs based on sophisticated analytics can help businesses understand the consumer, but the key is to use data to do things for people rather than for the business alone. She provided a couple of examples – UK-based grocer Sainsbury, which analyzed what people were buying to discover who might be prone to heart conditions and hence improve targeting for medication and wellness marketing campaigns, and Sephora, which developed “Inform” analytics to remind customers what they had bought in the past to ease the shopping experience – in order to introduce issues around this practice of ‘personalization’.
While personal information can inform service delivery, Doniz argued that consumers today also want transparency around how their data is being used, the ability to turn the data flow off, as well as information on who has accessed their personal data. Largely a government responsibility, the privacy of personal data is also a challenge for CIOs, she argued, who typically do not have a lot of experience in this area. What kinds of limits should be placed on information sharing, what is necessary to collect and what institutions do consumers trust with information like a “digital ID” are all questions that still need to be resolved.
CFO for Kognitive Marketing Atif Ansari made a strong case for creating customer experience through the use of cloud computing, illustrating the benefits of this data delivery approach through description of his work with Bank of America. Ansari asked: “performance measurement takes a long time…. how do you simplify it, [and move data from back office systems] so that it serves the front office who can use it to better serve customers”?
Since bank transactions are typically managed on a quarterly basis, Ansari explained that traditionally it has been necessary to build huge computing systems that were not attuned to this kind of schedule, but could provide capacity when demand was at peak. While this practice is common, it is extremely costly. As a result, the bank moved to cloud, dramatically reducing the costs associated with data housing and management (savings in the millions Ansari added), while also delivering instant access to data for field workers. The financial investment advisor, for example, who is now able to access cloud data to show the customer everything about his individual portfolio in real time in the field.
Ansari acknowledged security and data residency concerns around cloud technology that linger in this sector, but argued that now that service providers can delivery virtual private cloud, located in Canada, there is increasing adoption of cloud within the financial services industry. Ansari’s perspective on cloud was not universal, however, and other session attendees voiced more reservation. For example, Curtis Gergley-Garner, chief risk officer at Canada Guaranty Mortgage Insurance Co., noted that cloud tends to be problematic at his organization since it works with bank data, and the banks in turn require that Canada Guaranty systems be as robust as their own: banks need to become comfortable with cloud data first, before insurers take this step, he insisted.
Similarly, Dion Yungblut, VP at Capital One, observed that while people are moving to cloud, the banks and regulators are not really there; a leader’s job, he said, involves understanding how stay on top of that – how to take advantage of “exponential growth of access to data and computing” and to to create “nimble IT infrastructure” if cloud is not ubiquitous. To clarify, Brad Struthers, director of collateral management and strategic alliances at RBC, pointed to the importance in this debate of separating out cloud computing and cloud storage, which may have different security management requirements. Lack of understanding issues like this, he added, may be preventing banking organizations from tapping into new technologies.
David Bradshaw’s data story was one of growth management. As the VP, client business support at Tangerine bank, explained, the Tangerine group predicted their transactional volume was going to grow by 48 percent with ramp up of operations, and built a “scalability model” based on Excel spreadsheets to figure out how to prevent operating costs from growing at the same rate. This model helped Tangerine to identify the areas that were going to expand most quickly, and which would benefit most from process optimization. Areas such as deposits, where manual management of fuzzy screen cheque photos proved a real bottleneck, as did the mailroom, mortgages and payments.
Through this analytics exercise, the organization was also able to estimate the potential savings that could be gained via the replacement of manual processes with technology, and to plug tools in to achieve significant improvements in focus areas like the mailroom. By streamlining processes and identifying the proper software tools to help increase operational efficiency and speed time to market, Tangerine managed to increase volumes by 45 percent with no increase in operating costs.
Curtis Gergley-Garner from Canada Guaranty launched his presentation with the observation that as a relatively new company in the mortgage insurance space with two very large competitors that have a lot more data than they do, the firm has to be very efficient with the data they do have.
From a business perspective, the goal of Canada Guaranty’s data strategy was to improve the efficiency, consistency and speed with which mortgage applications are approved, decrease the cancellation rate (as frustrated customers look elsewhere), improve customer service, ultimately, the overall quality of Canada Guaranty credit. To achieve this, the firm mounted in two specific data projects. One involved the creation of a proprietary scorecard, based on trended credit bureau information over five quarters, which enhanced the company’s ability to predict forward default. On the property side, Canada Guaranty also worked with DMTI Spatial to implement the Location Hub platform, which addresses problems with ambiguous addressing through the Unique Address Identifier (UAID) standard, and by analysing the address quality in a customer data set based on automated error checking.
As Gergley-Garner explained, when individuals input address data, it’s not uncommon for errors to occur; by the same token, it is difficult to achieve an “automated value model” when address data is wrong and easy to “miss a lot of hits” in address search.
The importance of data cleansing, data integrity and completeness of the data set – in location information and other areas – to the implementation of solutions that can support business objectives was echoed by other session participants. Noting regulators’ move from structured data models to real time analytics models, Parag Gupta of the Northbridge Financial Corporation asked “How can you clean up their data?” and “what kind of problem does this cause for the insurance business?” Pointing to the fact that it’s typical for an organization to have lots of data in one area, and shortages in others, Brad Struthers from RBC asked “how is it possible to fill in the gaps?”
If no definitive answers to these data quality issues or to questions that linger around privacy and the use of cloud emerged at the session, by drawing together individuals with similar industry experience who ask the right questions, DMTI hosts are helping to shape an ongoing and healthy dialogue on best practice in the use of financial data and analytics.
Contact us to learn more.

“They don’t know that we know that they know we know!” – Phoebe Buffay
What do you know? About your customers that is.
Most likely you have assumptions and these assumptions are often backed by data. Perhaps a survey that was conducted a few years ago, or through your experience with your clients first hand. Regardless of how you have acquired this intel, what you think you know about your customers is what should drive your business. But does it?
Who is your ideal customer? Your absolutely worst customer? Who would you be lucky to nab this quarter? Who could be your Lighthouse Customer?
These questions swim around every Marketer’s, Sale’s and Product Manager’s brain when building new marketing campaigns or planning new sales initiatives. The reality is, we think we have a good idea but may not have enough data to back it up.
Try googling “Ideal Customer”. A lot of businesses think they know the secret formula, but it should be you who determines who is ideal for your business.
Ask yourself these questions:
Once you have begun to identify who your target customer should be, let the data tell you otherwise. From our experience at DMTI Spatial™ the data often surprises our clients. Most are unaware their database contains inaccurate and outdated data. Often times CRM’s are not kept up to date when employee attrition or customer churn takes place. Your data is what drives your business, not the other way around.
Need help cleaning this mess up? Start with the basics. Cleanse your address database. Then, ensure your customer records are up to date. Are you customers current? If not, when did they leave?
Once you’ve done this, enrich the data with as much information as possible. What campaigns went out to these customers? When did we reach out to them last? Start with the basics and build a rich repository of data.
Your data is what makes your business unique. Leverage and exploit this well of information to determine who your actual ideal customer is.
Need help? That is where Location Hub® Analytics comes in.
To learn more about how location analytics can help your business, shoot us an email or give us a call at 1.877.477.3684 .

Our new Predictive Analytics product launches in less than 2 weeks! As we approach this exciting milestone, we anxiously anticipate the loud ‘splash’ when LEADS (the codename for the product) finally hits the market. I use splash somewhat literally and quite purposefully, as we reside in the era of the “data lake.”
The buzz term data lake is progressively used to describe “a state in which all data resides in one environment and can be explored and interpreted without imposing a schema”. Martin Willcox of Teradata eloquently describes the data lake as promoting three big ideas:
Picture yourself fishing in a small canoe in a vast open body of peaceful water. As you peer over the side of the canoe you can see clearly beneath the surface into a limitless sea. Within the waters you can see hundreds, if not thousands, of fish swimming carefree. Each fish is a different color and each fish carelessly brushes against your line. As each fish passes your fishing rod tremors, but it is not until the right fish decides to take the bait that you begin the experience of fighting for your prize.
Welcome to the data lake. Each fish is a new variable or piece of data you may or may not have seen before. This intelligence you have been exposed to will allow you to gain the valuable insight from a sea of information that is seemingly too difficult or disparate to collect yourself.
This is what LEADS will do. Stay Tuned!
Click here to see DMTI’s GIS Mapping software solution.

What if Santa could:
A lot can happen in a year, especially in Canada. 10,000 postal codes were added last year and the latest census showed significant variety of changes happened within Canada.
If Santa used his list, location and neighbourhood level data – he could do the following:
Santa after making his list and checking it twice to find out who is naughty or nice now has a problem before he comes to town! Santa with his large list of names and addresses can now:
“Santa Claus is coming to town!” “Santa Claus is coming to town!” “Santa…Claus….is coming to…”
Wait – can Santa optimize his route to town?
Santa has decided to upgrade his sleigh navigation system to include address points so that he can see everybody and check them off his list as he delivers his parcels and goodies.
Merry Christmas and Happy Holidays from everyone at DMTI Spatial!