GIS Mapping Software

A Lesson in Map-Folding Origami

Do you use maps? I’m fairly certain you do, possibly a GIS mapping app on a daily basis. When I was 16 and learning to drive maps were these sticky, dirty, impossible to fold, gigantic pieces of paper I always managed to rip while shoving back into the glove box. “You be the navigator, I’ll be the driver.” Remember those days?

Today we don’t have to worry about map origami (seriously, who actually folded it right the first time?!). I personally have 2 mapping apps on my Android, both of which have totally different purposes.

GIS Mapping Apps in order of favouritism:

1) Waze – Hands down one of the most fun and accurate traffic applications out there. Excellent UI and hilariously fun Voice Navigation, (I highly encourage everyone to try “Boy Band”). This app is intended to effortlessly navigate you through high traffic and accident-prone areas. Definitely my choice of app when it comes to getting from A to B.

2) Google Maps – With over 4.8 million Android users alone, this application is well known for its pros and cons. While it is definitely the easiest application to operate, it nearly never locates my gps position in under 5 minutes. This is my app of choice when looking up an area or trying to find a specific address.

You will notice these apps are very centered around my inability to navigate when driving, or using transit. How else would I use maps as a consumer?

Here’s Why the Average Person Needs a GIS Mapping App:

  • Get me from Home to ‘X’
  • Get me from Work to ‘X’
  • Find me the closest Subway to ‘X’

Pretty simple isn’t it? Not if you’re a Business.

Using GIS Mapping Software in the Business World

Maps in the business world are complex. Heck, that’s why we have GIS mapping apps. As this Esri link tells us, nearly every business benefits from understanding their environment. Better decision making, cost savings, etc. Whether you are in Retail, Land Development, or Health Care, it matters to know where your Customers/Clients are located. Better yet, if you have a GIS professional on your team – they can build you a map!

Take Health Care for example. DMTI Spatial worked with the Ontario Medical Association to understand where their Physicians were located in relation to the population in Ontario. While this exercise sounds easy, it was a complex project that resulted in a table of over 142 billion records – one of the largest data deliveries in DMTI’s 20 year history. Where your Customers are located matters.

Now consider Retail. What if you found out your most loyal customers (aka the ones that spend the big bucks) are located within 10 km of your store. Would you consider marketing to these neighbourhoods? Or divert marketing dollars that were intended for a 30km + distribution?

Today we use maps to make business decisions. Only these maps are digital, and sometimes come with a boy band singsong voiceover (again, I highly suggest it).

Want to integrate a basic map into your Business process? Want to visualize where your customers are? Let me know and I can help. But, I can’t fold that blasted paper map back up for you.

Calgary Flood

Calgary Flood – 2 years later. Where are we now?

It has been 2 years since the 2013 Calgary floods that occurred in Southern and Central Alberta.  What’s changed?

Overland Flood Insurance Availability

In 2014, Canada’s Economic Action Plan noted that “Canada is the only G-8 country without residential flood insurance coverage, leaving many Canadian homeowners with inadequate protection against losses from overland flood events.”

In 2015, Canadian insurance providers began offering overland water protection for residential property owner across Canada.

Aviva Canada was the first to introduce this change to the market followed shortly after by The Co-operators with Alberta being the immediate focus and other subsequent provinces to be rolled out over time.

 A better understanding of flood risk

According to the Canadian Underwriter:

Flooding is the most common type of natural disaster in Canada and the flood in southern Alberta in 2013 was the most costly storm in Canadian history. “In general,” overland flooding is not currently covered on home insurance policies, the Insurance Bureau of Canada said recently on its website.

A number of vendors have begun to offer hazard maps that help companies determine

The first vendor to market was JBA Risk Management and in May 2015 Aon Benfield began offering this type of data to Canadian insurance companies.

A better understanding of portfolio risk

As the usage of flood hazard maps increases, they will also seek detailed property location information to ensure that they understand where current and new customers are located in reference to these boundaries.

Insurance companies typically utilize three (3) different boundaries from the first three digits of the postal code to the address when analyzing flood risk:

Boundaries Number of unique records in Canada 2015
Forward Sortation Areas (FSA) 1.6K
Postal Codes (FSA LDU) 857K
Addresses 15M

Address level accuracy should be considered when mapping (geocoding) your portfolio against flood hazard boundaries versus the use of postal codes to better understand risk.  Using postal codes without understanding how many individual properties are associated to it in relation an event boundary may lead to the stigmatization of that entire postal code even though only a few addresses may be impacted.

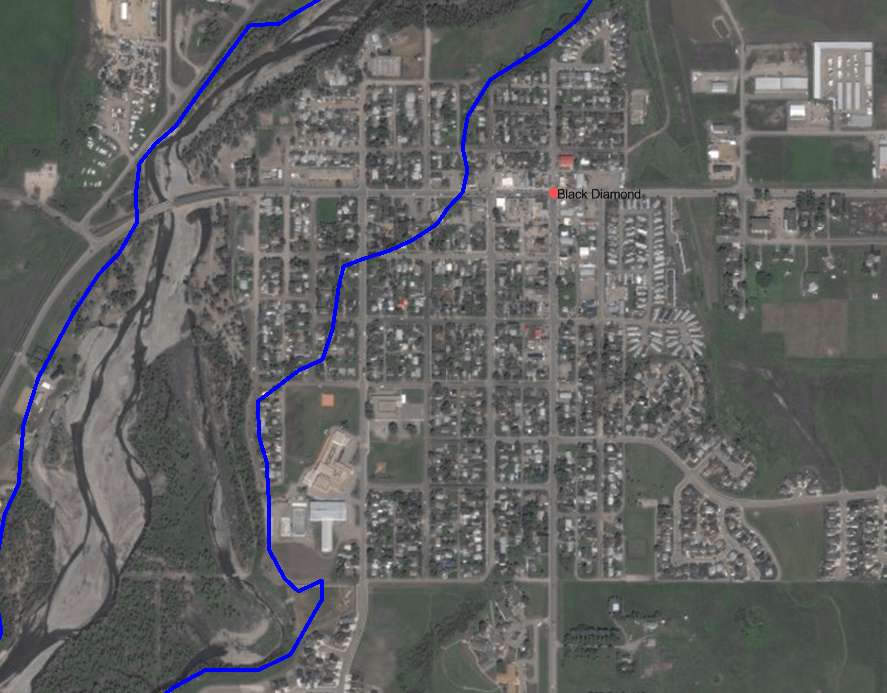
Below is an example for the municipality of Black Diamond, Alberta which has one postal code (T0L0H0) and over 1,000 addresses associated with it. The blue boundary represents the flood boundary from the Alberta 2013 floods.

data visualization tools

The map below depicts the same area where the blue boundary represents the flood boundary from the Alberta 2013 floods:

data visualization tools

Data maintenance is essential to ensuring high-precision accuracy.

Alberta municipalities Number of new addresses added since 2014
Calgary 31,897
High River 281

Address level precision should be utilized when comparing flood information to policies and performing other forms of analyses such as concentration analysis and proximity to other perils such as risk (e.g., underground tanks).

Click the links below to learn more about disaster risk management and disaster visualization tools:

To learn more about how your book of business may be impacted by overland flood in Canada, please contact us.


Building Location Technology

In the Beginning There Were Maps: 20 years of DMTI history

“The overall mission and goals of the company have remained virtually unchanged throughout our history.”  – John Fisher, Founder – DMTI Spatial

In 1994, DMTI Spatial was born with the purpose of helping our customers improve the way they did business by leveraging the power of location. We knew that location was special, and had enormous potential to improve decision making and operations, and we had a unique ability to harness it.

We set out to be a software company, but we found that the software was useless without good foundation mapping to support it.  So first we built the maps. We could have done what others were doing – driving the roads to build the maps. But we wanted to create foundation data for many purposes, not just navigation – so we needed a better way.

Canada – the birthplace for GIS

Being based in Canada, we were fortunate. A country as large as Canada with a relatively small population needs a way to administer the huge tracts of land very efficiently. Because of this there was a huge legacy of digital map data available.  The only problem: it was a patchwork of uncoordinated bits. It needed to be seamed together from a variety of sources.

We figured the only way to accomplish this massive undertaking was to automate as much as possible. So we did. We created software to do most of the work, and supplemented with skilled labour (GIS technicians) to handle what the automation couldn’t.

Canada’s first digital street map

DMTI Spatial created the first coast-to-coast digital street map for Canada, using the National Topographic Database from Natural Resources Canada as the primary base, supplemented by many other federal, provincial and municipal datasets. We called it CanMap®, and it was the definitive Canadian base map for digital applications.

As our customers became more sophisticated in their use of the technology, there was a need to add more depth and precision to our maps. We added hundreds of layers of data to the street map fabric, including postal geography, electoral geography, 3 dimensional Digital Elevation Model (DEM) data and many others. We built a complete, seamless water layer for Canada, connecting all of the streams, lakes and rivers. For inter-modal transportation, we created a national rail network. For the mobile phone industry we created coast-to-coast clutter mapping for radio propagation analysis – which was used by telecommunications companies to deploy national cellular coverage. We built land use models, assembled demographics and built point of interest data.

And we called it CanMap 2.0

CanMap 2.0 set a new bar for location data excellence in the marketplace.

Others sought us out to build data for them and we built out over 10 million parcel boundaries for the U.S. for First American®.

A history of firsts

A fundamental tool for using location data efficiently is the geocoder. We were not happy with the quality of the available geocoders, so we set out to build our own. Based on our superior knowledge of Canadian geography and Canadian addresses we designed a solution that would make use of the high precision and extensive attribution of the CanMap base. Since Canada is bilingual we created a French-English geocoder, the first in the world.

To add greater precision we developed point level addresses – another first – and incorporated this data into the first point address geocoder.

By the time DMTI Spatial was 10 years old we had a huge catalogue of data products with thousands of variations. We began to combine our technology and data with others in new and different ways to create new hybrid products.

Thinking outside the box

Around this time we came up with a revolutionary new idea – why not combine the digital vector data such as our CanMap street maps with raster imagery – satellite and airborne – to create a new hybrid map/image? We approached Digital Globe and proposed a partnership – a co-branded product we called Satellite Streetview. Digital Globe was so impressed with this product that they started showing it around, and caught the attention of an internet search company. That company was Google™.

Our customers began to ask how were able to combine such large volumes of disparate data into one seamless database. They said that they had similar issues with their own data and wondered if we could help. To solve this problem we repurposed our internal data consolidation software and geocoding software, and Location Hub® was born.

A key innovation was the development and use of a persistent location ID – the Unique Address Identifier (UAID®), as a simple, elegant way to tie all data associated with a particular location to one unambiguous index key.

Based on the success of Location Hub and the UAID we then expanded this capability to embrace the wide world of 3rd party data. If we were able to stamp all incoming data records with a UAID, then any database processed through Location Hub would be instantly integrated with all other datasets processed through the Hub. And so the Location Economics Ecosystem was born.

What’s in store for 2015?

With all this data and processing power available in one software platform, the next logical step was to add analytics to the mix.  DMTI Spatial is getting ready to deploy a new Location-based analytics product this spring. It’s totally new to the spatial visualization field, is incredibly fast and efficient at profiling, requires very little data awareness and manipulation, and is geared to fit multiple verticals without breaking much of a sweat.

Building on our heritage of innovation and creativity, we continue will to help businesses grow through actionable insights uncovered by leveraging location to bring together and analyze a growing world of data. We will continue to make breakthrough products that change the way people use location.

~ John Fisher, Founder – DMTI Spatial

Click here to see how DMTI helps businesses throughout Canada leverage location technology.

Flood risk

Are Insurance Companies Measuring Flood Risk Accurately?

On Feb 19 2015, Aviva Canada announced the availability of overland water endorsement. This meant homeowner coverage in Ontario and Alberta would start in May, and roll out to additional provinces throughout 2015.

In Canada, we now have national flood hazard maps and the ability to easily map each of our policies.

“What gets measured, gets managed” – Peter Drucker

Data Visualization Tools for Flood Risk

Patrick Lundy (CEO) of Zurich Canada said:

“Having the right tools, maps and predictive models is key to charging an accurate price for the risk, and capacity in certain areas may become harder to come by. Updated flood zone maps for Canada are of the utmost importance in being able to respond accurately to the increased flooding activity.” (Canadian Underwriter, 2013)

Today, insurance organizations have the ability to:

  • Identify and assess significant exposures in their portfolio
  • Identify new business without growing their 1/n year flood loss
  • Determine where they should not write new business
  • Identify flood risk which may require a more detailed assessment

“Opportunities multiply as they are seized” – Sun Tzu

Insurance Bureau of Canada (IBC) identified that overland flooding is a risk, but this is for a small percentage of the population. This refers to those who live in floodplains or flood prone areas close to rivers or lakes.

Leveraging this knowledge may lead to the creation of a new niche product offering for overland flood.

“Once we know something, we find it hard to imagine what it was like not to know it” – Chip & Dan Heath, Authors of Made to Stick, Switch

The Real Flood Risk

Van Bakel of Crawford recalled discussions that insurance companies shouldn’t worry about catastrophic events, and that everything was accounted for internally.

Fast forward about six weeks. Two of the most populated areas of Canada would never flood within two weeks of each other, would they?”

Overland flood hazard maps and precise mapping (or geocoding) technology allows insurance companies to:

  • Understand the risk to your book of business
  • Identify which markets may have flood risk
  • Create new pricing models based on this risk
  • Generate new product revenue for the business

Click here to learn more about how your book of business may be impacted by overland flood in Canada, or contact us at info@dmtispatial.com.


Location Intelligence

A Holiday Greeting from DMTI Spatial

Come check out the story of how Santa lost his famous book and Christmas was almost lost – were it not for the power of Location Intelligence. Written, recorded and animated by the staff of DMTI Spatial. Happy Holidays to all our customers and partners.


Location Intelligence for Enterprise

Challenges, Drivers and the Need for Location Intelligence

Even organizations that understand the value of location intelligence struggle to translate that understanding into meaningful profit-generating activities.

Much of the difficulty stems from the challenges of marrying enterprise data, which is typically housed in relational databases, to fully spatial-enabled information. New solutions that provide access to a platform of technology and crucial data building blocks that are integrated into an enterprise’s information processing cycle are available.

The result is a clean, current and consolidated view of enterprise information revealing new opportunities to enhance profitability.

3 drivers of location intelligence in the enterprise market are:

  1. The availability of high quality, current and complete data: Commercial geographic content providers are getting more sophisticated in the data offerings made available (e.g. to the building units in apartment buildings) allowing for a hyper-local perspective in business applications not previously available. Full service providers of location intelligence include subscriptions to geographic data that is maintained and developed on an on-going basis.
  2. Growing awareness of location-enabled services: Location intelligence has been popularized by business to consumer (B2C) applications from Internet search portals and personal navigation device (PND) vendors; and this increased awareness is moving into the Enterprise segment of the market.
  3. The rise of web services as a better-faster-cheaper deployment model: Software as a Service (SaaS) is now recognized as an agent that transforms how companies do business and is one of the most compelling innovations allowing for deployments of location intelligence that are cost effective. Solutions and delivery models are maturing and can be adopted without any disruption to existing IT structures or data modeling applications, reducing the attendant risk and expense.

More and more, the value of location intelligence is being linked to strategic and operational success at an enterprise level. As a means of generating revenues and controlling expenditures, location intelligence can directly impact profitability. Click here to learn more about how DMTI can help you leverage location intelligence.