Posts

Flood Data and Location Intelligence

Leveraging Flood Analysis to Mitigate Risk

Condo popularity is on the rise and for those financing the properties, whether it be a reputable financial institution or the bank of mom and Dad, is your investment protected? What happens in the event of a flood and are you asking all of the right questions before investing? For example, are you investing in properties that are a high risk to flood? With help from DMTI, we’re able to take a closer look on a few regions to understand your exposure.

What risk does flood pose in Canada?

Floods are the most frequently occurring natural hazard in Canada. According to the Institute for Catastrophic Loss Reduction (ICLR), the Canadian Disaster Database indicates that 241 flood disasters have occurred in Canada between the years 1900 and 2005, almost five times as many as the next most common disaster (wildfire). Over the past few decades, urban flooding has been a growing problem, resulting in more than $20 billion in flood damage between 2003 and 2012, according to the federal government.

What is the risk of flood peril to condos in Canada?

In order to provide answers to this question, a condominium database for Canada was created by Teranet and DMTI Spatial combined with flood hazard maps highlighting areas that could be impacted by river flood (where the water rises over its banks), surface water (where water will pool due to elevation differences) and storm surge (coastal flooding). Three key markets were focused on as part of this analysis: Toronto, Vancouver and Montreal.

Toronto, ON

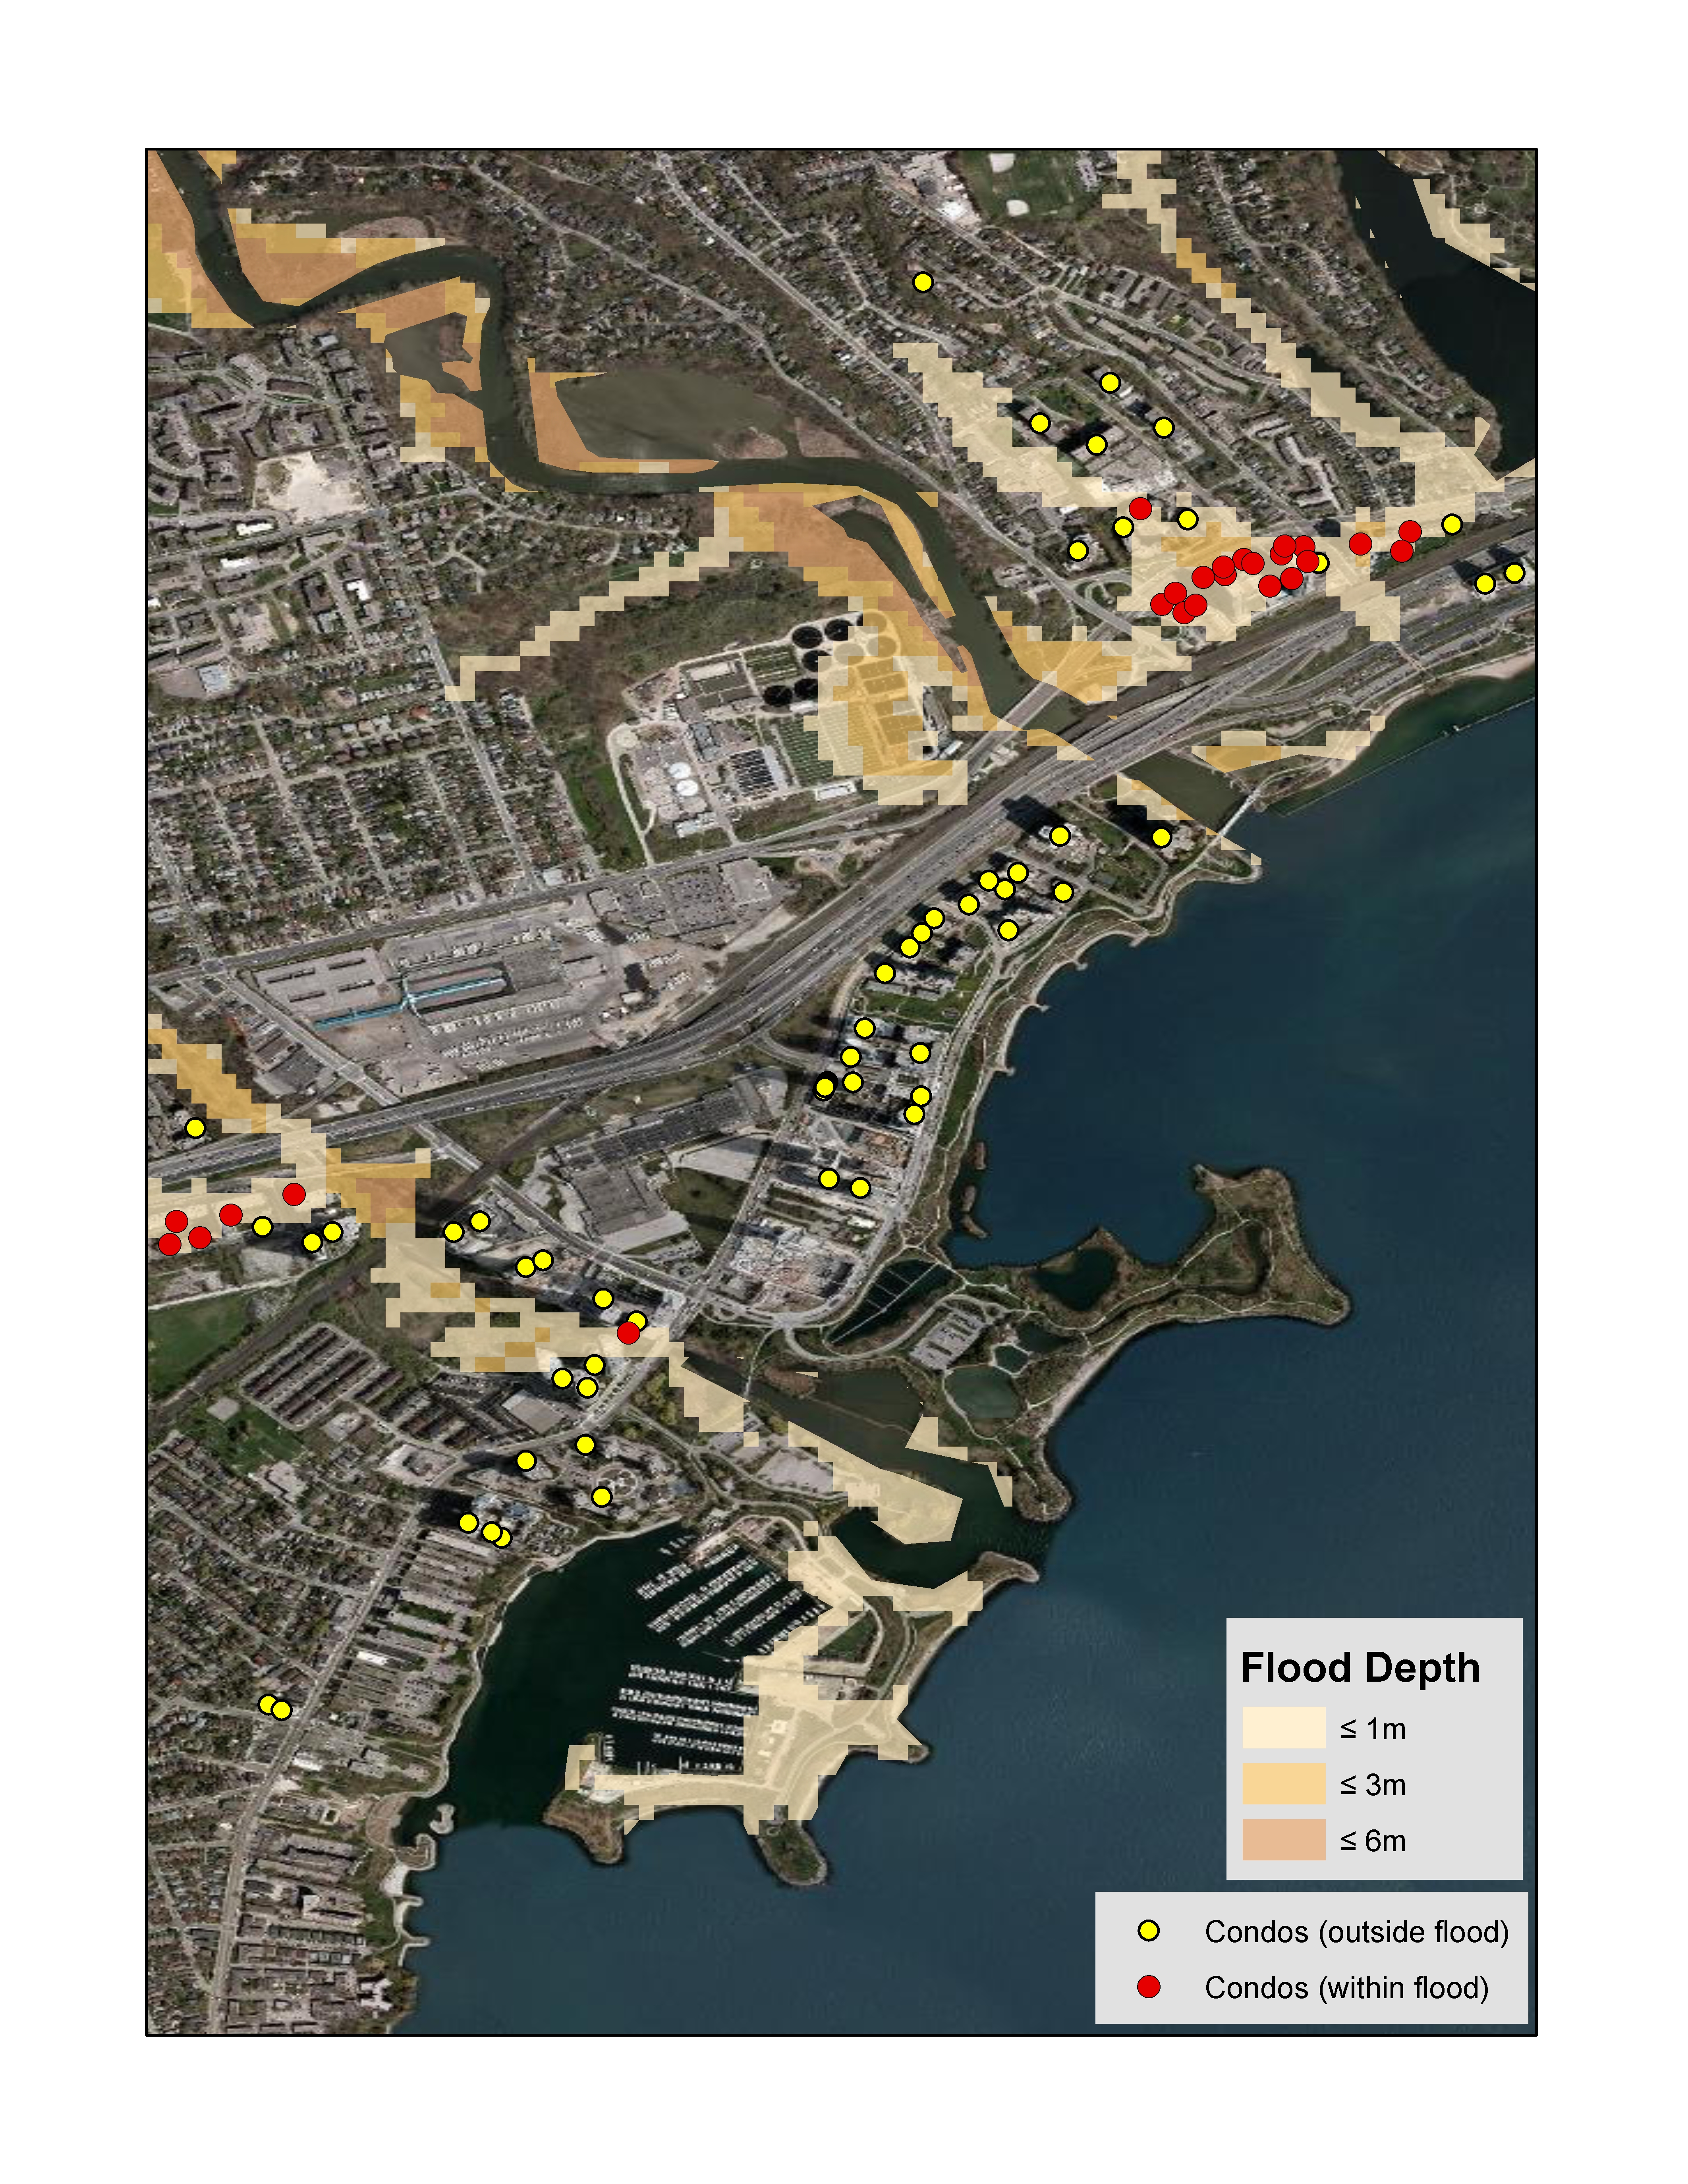
The flood risk analysis (using 1/100 year return period) for Toronto revealed that approx. 1.2% of all condo buildings may be impacted by river flood risk and approx. 5.9% of all condo buildings may be impacted by surface water flood risk.

Toronto

Toronto

Figure #1: Toronto, Ontario – Condos falling within the river flood hazard map for the 1/100 year return period.

Vancouver, BC

The flood risk analysis (using the 1/100 year return period) in Vancouver revealed that approx. 7.3% of all condo buildings may be impacted by surface water risk and approx. 3.2% of all condo buildings may be impacted by storm surge flood risk

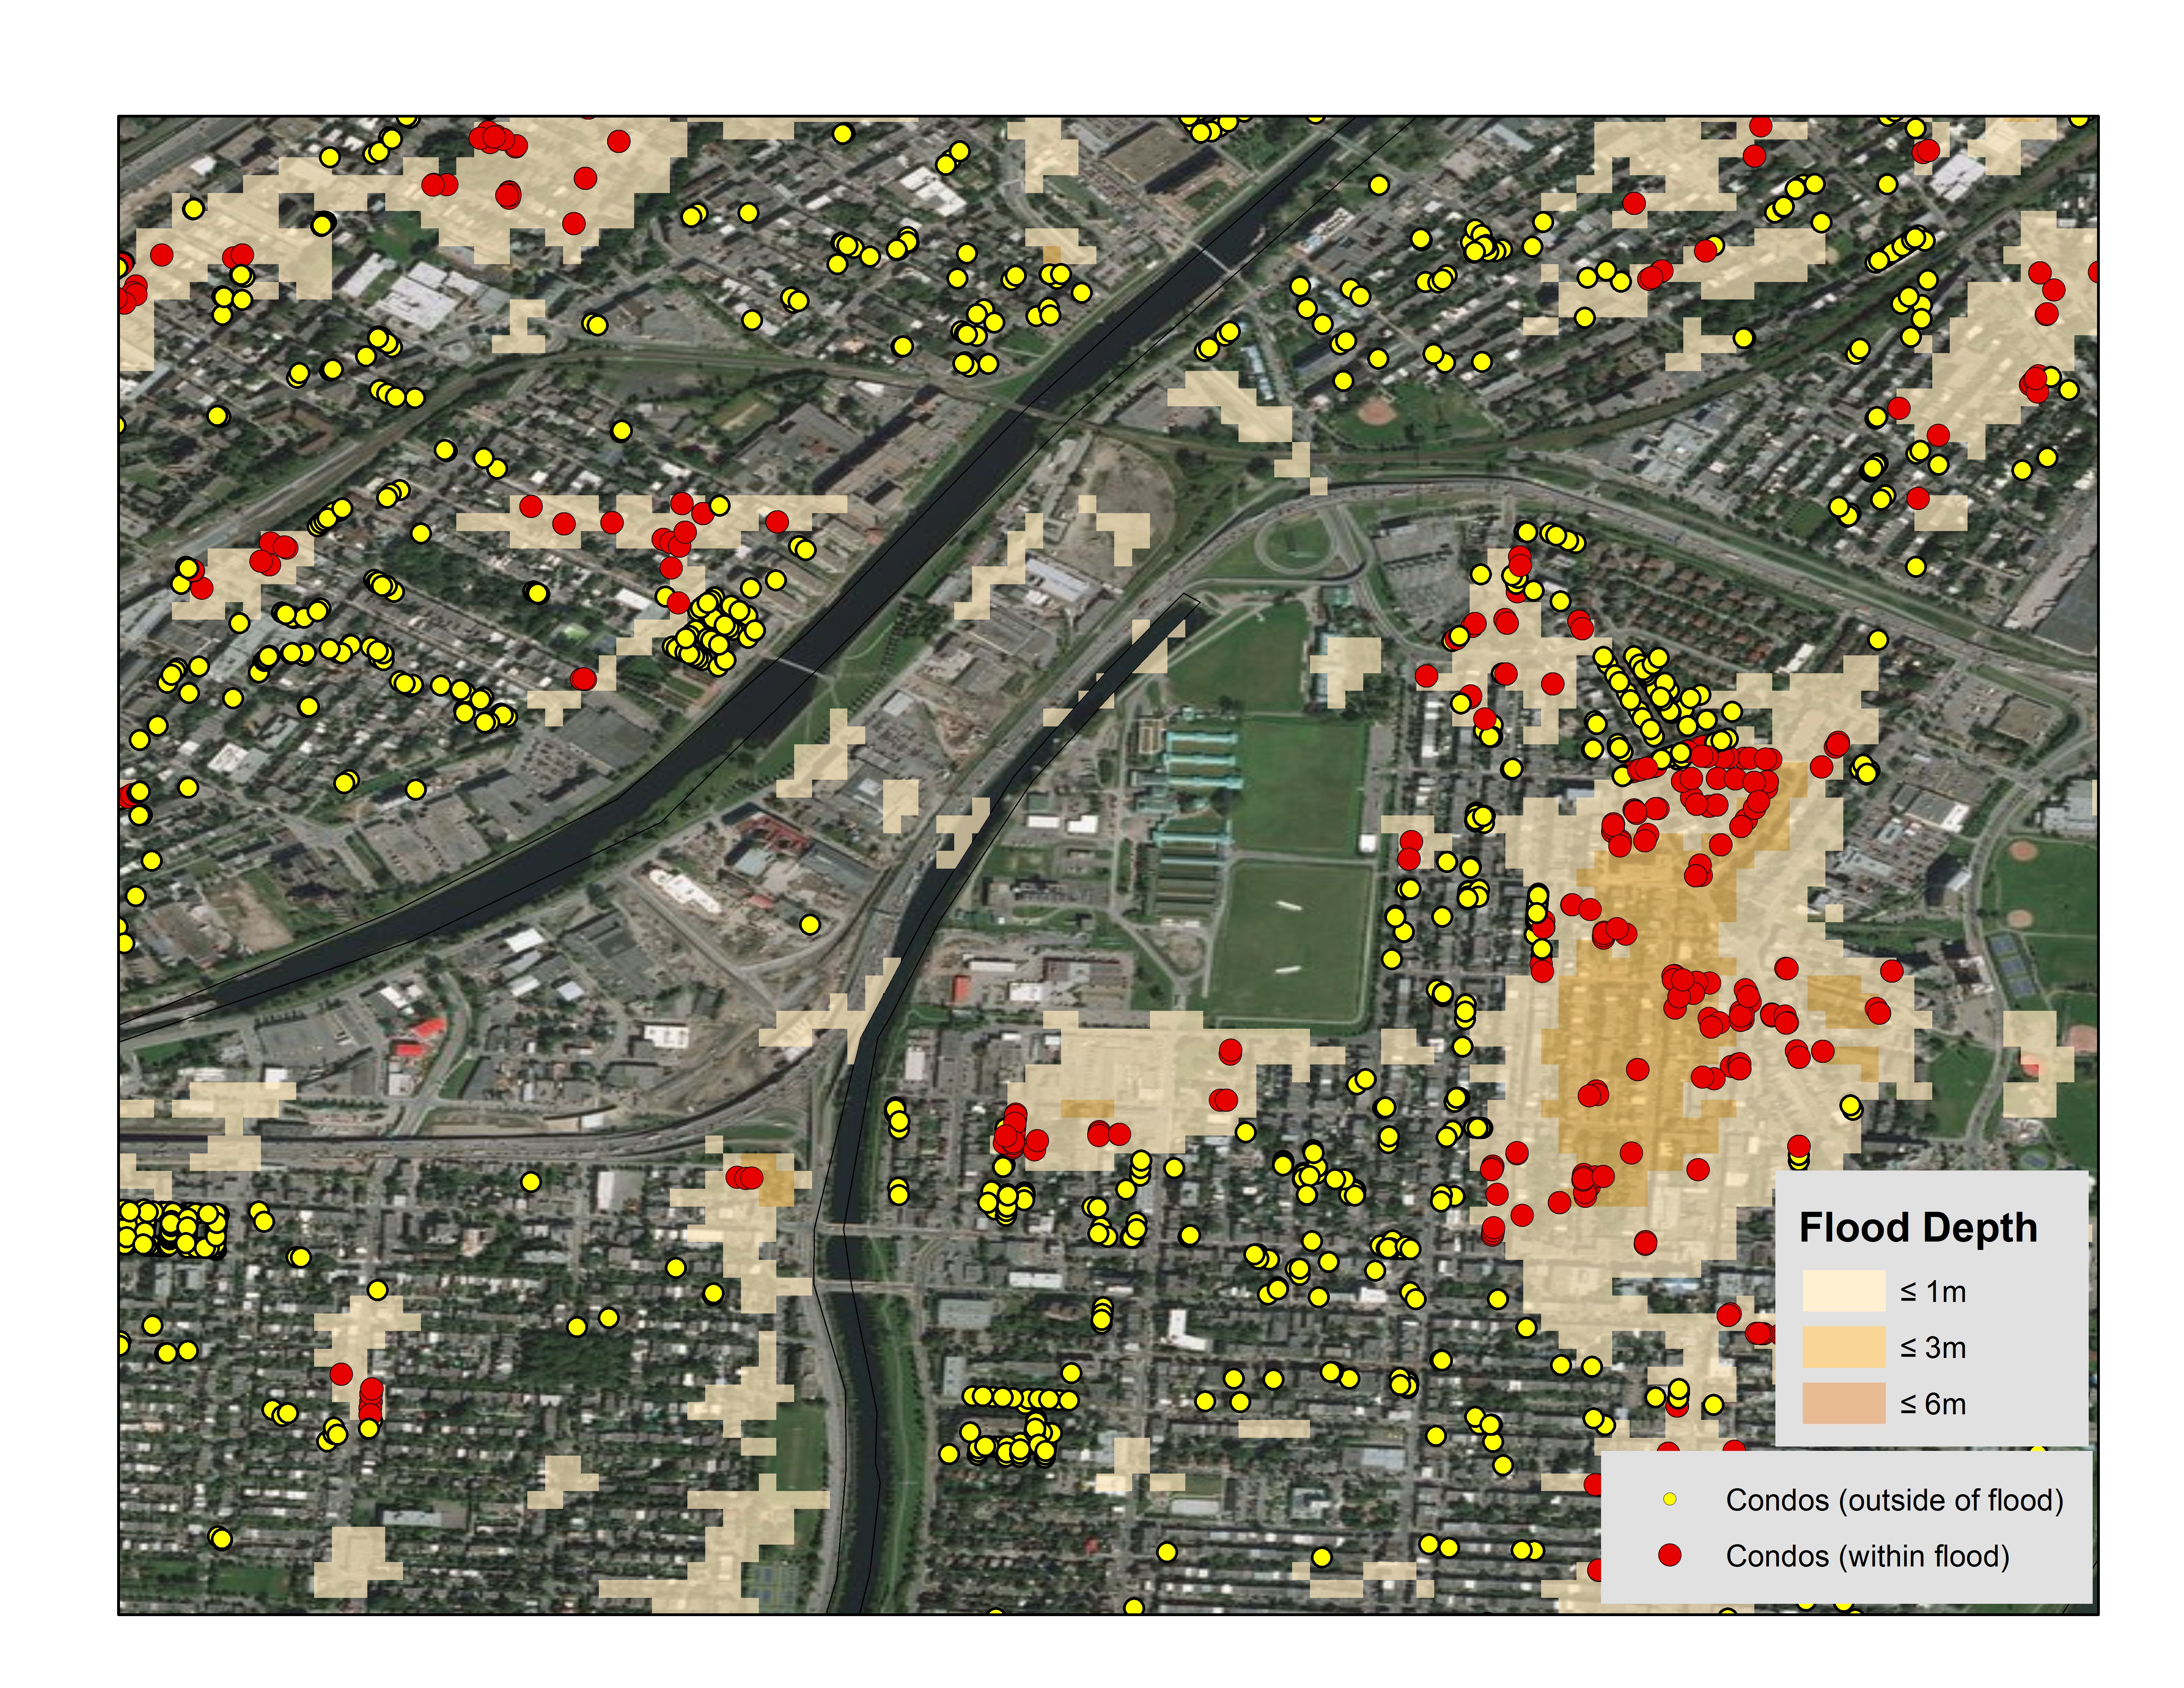
Figure 2: Vancouver, British Columbia – Condos falling within the surface water hazard map for the 1/100 year return period

Montreal, QC

The flood analysis (using the 1/100 year return period) in Toronto revealed that approx. 15.0% of all condo buildings may be impacted by river flood risk and approx. 11.4% of all condo buildings may be impacted by surface water flood risk.

Figure 3: Montreal, Quebec – Condos falling within the surface water hazard map for the 1/100 year return period

What does this mean to my business?

As per the Insurance Bureau of Canada (IBC) for flood perils, 20% of Canadian households could be qualified as high risk, and about 10% of those would be considered very high risk which equates to about 1.8 million households. Understanding the impact of natural disasters such as catastrophic flooding is a complex issue. Many customers are challenged with identifying and mitigating their total risk and exposure within their existing portfolio. Here are some additional areas for consideration that would benefit from this type of analysis:

  • Risk Mitigation: Enhance real-time mortgage adjudication processes, speed time to decision and reduce manual intervention with enhanced insight into the precise location of the property as it relates to a flood zone.
  • Risk Analysis: Validate capital adequacy requirements and better understand and reduce exposure by being able to assess the total accumulated risk to a portfolio as it relates to proximity within flood plains.
  • Site Planning: Enhance infrastructure and site planning analysis by understanding the potential risk of flood before deployment.

The analysis conducted by DMTI Spatial using its platform Location Hub supports real-time flood risk analysis, portfolio accumulation risk analysis and the real-time visualization of the potential exposure to flood zones. This provides key data of importance to better forecast exposure and mitigate risk.

Contact us to learn more

Location Data and the Telecom Industry

Top 5 ways the Telecom sector is leveraging Location Data

Read to know why 70% of telecom companies are convinced that accurate location data is critical to their success

A telecom business has to face a range of burning questions on a regular basis: Where are my customers? Where is my crew needed the most? Where do I need to expand capacity? Where is my network lacking quality? Each of these questions has a foundation in spatial information.

For an industry as competitive as telecommunications, understanding relationships, trends, and patterns in a quick and efficient way is imperative to keep up with the evolving market dynamics. Location data helps telecom operators to visualize the myriad layers of data in a manner which is easy to understand and interpret. But even more importantly, it helps unlock pertinent insights previously not available to the business. So, it’s not surprising that the 2018 Location Intelligence Market Study by Dresner Advisory Services pegs location data as a key success factor for 70% of telecom companies.

Let’s discuss some of the most profitable ways in which the telecom sector is leveraging location data…

1.  Market Segmentation

Location data is the underpinning of all market segmentation activities like identifying high-revenue areas, segregating customers on the basis of their demography and buying behaviour, ascertaining where new building projects are coming up, or even undertaking a competitor analysis. Prudent telecom operators are using location data to boost their intelligence with customer profiling and determine the potential of the market correctly. This further allows them to determine where new capital investment needs to be allocated and where marketing budgets should be channeled for maximum impact.

2.  Network Analysis

Using accurate location data gives operators and crew instant access to customer details, enabling them to map signal quality information with their user base and identify where the signal strength is good or poor. Being able to visualize assets geographically also allows for better monitoring of the network and expedition of maintenance and repairs. And when it comes to making inroads into an already competitive market, precise location data helps telecom companies to identify new market opportunities in the proximity of their assets and expand network capacity in a cost-effective manner. Which brings us to the next point in our list…

3.  Capacity Planning

To plan and manage their capacity judiciously, telecom companies not only need to be able to map their current user base properly, they should be able to locate the pockets of future growth meticulously. Using location data, companies can zero in on new prospects by leveraging insights into current profitable customers to look for similar prospects. Here, the intelligence derived through market segmentation activities also comes into play. Location data analytics provide a solid decision-support ground for capital investments.

4.  Serviceability

The importance of providing a definitive and timely service cost assessment for new customers is not lost on progressive telco businesses. Accurate address information gives the sales team the confidence to upsell products without worrying about the availability of those services. When it comes to analyzing and tracking the serviceability for commercial accounts, telcos can easily map location information against serviceability and make sure a new customer opportunity does not turn into a bad customer service problem. Businesses can even plan to increase serviceability based on the competitive insights derived from authentic location data.

5. Customer Service

Effective customer relationship management gives a much-needed competitive edge to telecom companies. Having a unique address identifier  for each customer can eliminate communication errors and boost the speed and quality of customer handling. By resolving user queries and complaints in a timely manner, operators can improve the relationship between the company and the customer, thereby reducing the chance of a customer jumping to another provider (churning). They can also make significant cost savings by reducing the need for return visits by the field crew.

In a nutshell, location data is a strategic planning tool the telecommunications industry can use to enhance its capabilities, reduce errors, and carry out processes more accurately. Forward-thinking telcos are already using location data to improve market penetration and enhance their network design and coverage. To know more about how your telecom business can leverage location data for better operational efficiency and customer satisfaction, contact us.

Additional Reading:


Data visualization for government

When a whole city changes…

Providing the best data visualization products for Canada means investing in the best sources of information possible. Streetfiles, postal codes and address points are key layers and must be accurate.

DMTI’s Data Visualization Tools

DMTI identifies areas to work on ranging from new subdivisions to urbanizing rural areas. Typically, the number of changes per area ranges from a few to a few hundred.

Our team occasionally encounters a scenario where a municipality has changed so much that it appears completely different. Everything is affected — from the street name to the postal codes that provide mail to their residents and businesses.

The Case of Shawinigan, QC.

Shawinigan is a city located on the Saint-Maurice River in the Mauricie area in Quebec, Canada. The population is 50,060 as of the Canada 2011 Census as per Wikipedia and 26,230 private dwellings occupied by usual residents.

As part of our focus on Canada, we are continually updating and comparing three (3) main sources of information. This includes  streets, postal codes and addresses.

Our data team compared the latest Canada Post data against the current database. We found that Shawinigan, QC – many addresses suddenly fell out due to changes.

An investigation revealed the area recently changed most of their addresses, and was planning to change more.  The Canada Post data was actually showing only about half of the changes. Nearly the whole area would be affected!

We compared this finding against additional sources to fact check the changes. Our team made the city-wide changes to our data as soon as possible.

The result was some Canada Post fallout within the product. But this allowed us to deliver greater accuracy and stay aligned with the changes.

Due to the scope of the changes (an entire municipality!) – the entire data team banded together and got this update into our upcoming Aug 2016.3 data release because of how important it is to ensure our products are in alignment.

Congratulations Data Team, and thank you for your on-going commitment to data quality and currency and all of the other changes that went into this release!

Click here to learn more about how DMTI Spatial delivers complete accuracy, helping businesses get ahead of the competition.

GIS Crime mapping app

Toronto Police Launch New Crime GIS Mapping Tool

Mapping data using tools is a powerful way to engage your audience. Today’s announcement by the Toronto Police of a crime-mapping tool is a great example of an interactive, online map to further engage the public. Crime-mapping tools can help solve major crimes by being able to visualize data on a map. Here’s a snippet of the story:

“The set of tools provides interactive mapping of crime information that will give the public up-to-date locations of what’s been happening in their communities,” Ian Williams, acting manager of business intelligence and analytics, said in a release.

Interacting with GIS Data

Data growth is set to continue at a fast rate, with data growing in volume, breadth, and complexity.

GIS has always been a powerful tool to help analysts make sense of vast amounts of information. We now have the ability to make this data available in a way that allows average users to interact and interpret the data. Audiences that don’t have traditional GIS background or experience in mapping can also use these tools.

Many datasets within our enterprises are capable of being mapped, but accurate geocoding, datasets and easy to use visualization tools are the key.

DMTI Spatial Data Visualization

Did you know that DMTI Spatial provides options?   Our datasets cover over 97% of Canadian addresses.  We update over 2,100 postal codes and 2,300 municipalities across Canada in the last 3 months alone.  And this data is available for use in mapping apps as well.   Our API brings high precision geocoding and address points directly into your customer solutions.

Are you struggling to implement data visualization? What challenges do you run up against in engaging your audience through mapping technologies?   Click here to learn how DMTI Spatial can help.

Calgary Flood

Calgary Flood – 2 years later. Where are we now?

It has been 2 years since the 2013 Calgary floods that occurred in Southern and Central Alberta.  What’s changed?

Overland Flood Insurance Availability

In 2014, Canada’s Economic Action Plan noted that “Canada is the only G-8 country without residential flood insurance coverage, leaving many Canadian homeowners with inadequate protection against losses from overland flood events.”

In 2015, Canadian insurance providers began offering overland water protection for residential property owner across Canada.

Aviva Canada was the first to introduce this change to the market followed shortly after by The Co-operators with Alberta being the immediate focus and other subsequent provinces to be rolled out over time.

 A better understanding of flood risk

According to the Canadian Underwriter:

Flooding is the most common type of natural disaster in Canada and the flood in southern Alberta in 2013 was the most costly storm in Canadian history. “In general,” overland flooding is not currently covered on home insurance policies, the Insurance Bureau of Canada said recently on its website.

A number of vendors have begun to offer hazard maps that help companies determine

The first vendor to market was JBA Risk Management and in May 2015 Aon Benfield began offering this type of data to Canadian insurance companies.

A better understanding of portfolio risk

As the usage of flood hazard maps increases, they will also seek detailed property location information to ensure that they understand where current and new customers are located in reference to these boundaries.

Insurance companies typically utilize three (3) different boundaries from the first three digits of the postal code to the address when analyzing flood risk:

Boundaries Number of unique records in Canada 2015
Forward Sortation Areas (FSA) 1.6K
Postal Codes (FSA LDU) 857K
Addresses 15M

Address level accuracy should be considered when mapping (geocoding) your portfolio against flood hazard boundaries versus the use of postal codes to better understand risk.  Using postal codes without understanding how many individual properties are associated to it in relation an event boundary may lead to the stigmatization of that entire postal code even though only a few addresses may be impacted.

Below is an example for the municipality of Black Diamond, Alberta which has one postal code (T0L0H0) and over 1,000 addresses associated with it. The blue boundary represents the flood boundary from the Alberta 2013 floods.

data visualization tools

The map below depicts the same area where the blue boundary represents the flood boundary from the Alberta 2013 floods:

data visualization tools

Data maintenance is essential to ensuring high-precision accuracy.

Alberta municipalities Number of new addresses added since 2014
Calgary 31,897
High River 281

Address level precision should be utilized when comparing flood information to policies and performing other forms of analyses such as concentration analysis and proximity to other perils such as risk (e.g., underground tanks).

Click the links below to learn more about disaster risk management and disaster visualization tools:

To learn more about how your book of business may be impacted by overland flood in Canada, please contact us.


Predictive Analytics Data

Gone fishin’… in a data lake? Predictive Analytics Launch!

Our new Predictive Analytics product launches in less than 2 weeks! As we approach this exciting milestone, we anxiously anticipate the loud ‘splash’ when LEADS (the codename for the product) finally hits the market. I use splash somewhat literally and quite purposefully, as we reside in the era of the “data lake.”

What is a Data Lake?

 The buzz term data lake is progressively used to describe “a state in which all data resides in one environment and can be explored and interpreted without imposing a schema”. Martin Willcox of Teradata eloquently describes the data lake as promoting three big ideas:

  1. Captures data in a centralized Hadoop-based repository
  2. Stores data in a raw form
  3. Enables the breakdown of barriers that inhibit analytics

Picture yourself fishing in a small canoe in a vast open body of peaceful water. As you peer over the side of the canoe you can see clearly beneath the surface into a limitless sea. Within the waters you can see hundreds, if not thousands, of fish swimming carefree. Each fish is a different color and each fish carelessly brushes against your line. As each fish passes your fishing rod tremors, but it is not until the right fish decides to take the bait that you begin the experience of fighting for your prize.

New Insights are Coming from DMTI

Welcome to the data lake. Each fish is a new variable or piece of data you may or may not have seen before. This intelligence you have been exposed to will allow you to gain the valuable insight from a sea of information that is seemingly too difficult or disparate to collect yourself.

This is what LEADS will do. Stay Tuned!

Click here to see DMTI’s GIS Mapping software solution.

Disaster risk management in oil spill

Properties, Oil and Water Don’t Mix

Oil and Water Don’t Mix.  That was especially true on Wed April 8, 2015 when a tanker in the English Bay in Vancouver was reported to be leaking fuel into the surrounding waters.

The spill amount was “above the norm” but not “catastrophic.” Local residents were warned to avoid the beaches on both sides of the bay, according to CBC News,

Transport Canada has reported the following major oil spills in western Canada:

  • In 1988, Vancouver Island was affected by a spill from an oil barge that lost approximately 87 tons of oil
  • In 2006, a B.C. ferry sank with 240 tons of oil on board.

Gauging the impact

You can view an event zone on a map and determine exposure quickly by linking impacted addresses to your book of business with DMTI’s Location Hub® Post Event Service. Custom event reports allow you to easily share exposure information across your organization. This ensures swift action and superior customer service.

What is the impact of oil spills on property values?

A report created by the Conversations for Responsible Economic Development (CRED) reveals the following key findings:

  • Both direct contamination & the perception of contamination have clear and well documented impacts
  • In several documented cases, directly impacted properties lost 10-40% of their value
  • The reputational impacts alone are significant – properties nearby spills will usually see a 5-8% reduction in value
  • The most significant impacts are felt in the first year and usually last less than 5 years

Assessing future risk

A proposed pipeline destined to carry more oil to the Westridge terminal in Burnaby, BC would increase the number of tankers traveling through Canadian waters from 5 to 34 per month (Global News).

How can organizations prepare?

  • Connect. Analyze. Act™
    • Seek a solution that provides timely and advanced insight into the duration, size, impact and number of addresses affected by an event. This allows you to easily share exposure information across your organization.
  • National insights in real-time
    • Take advantage of an offering that delivers property level event information and other perils that may impact your book of business.

How can I learn more?


Building Location Technology

In the Beginning There Were Maps: 20 years of DMTI history

“The overall mission and goals of the company have remained virtually unchanged throughout our history.”  – John Fisher, Founder – DMTI Spatial

In 1994, DMTI Spatial was born with the purpose of helping our customers improve the way they did business by leveraging the power of location. We knew that location was special, and had enormous potential to improve decision making and operations, and we had a unique ability to harness it.

We set out to be a software company, but we found that the software was useless without good foundation mapping to support it.  So first we built the maps. We could have done what others were doing – driving the roads to build the maps. But we wanted to create foundation data for many purposes, not just navigation – so we needed a better way.

Canada – the birthplace for GIS

Being based in Canada, we were fortunate. A country as large as Canada with a relatively small population needs a way to administer the huge tracts of land very efficiently. Because of this there was a huge legacy of digital map data available.  The only problem: it was a patchwork of uncoordinated bits. It needed to be seamed together from a variety of sources.

We figured the only way to accomplish this massive undertaking was to automate as much as possible. So we did. We created software to do most of the work, and supplemented with skilled labour (GIS technicians) to handle what the automation couldn’t.

Canada’s first digital street map

DMTI Spatial created the first coast-to-coast digital street map for Canada, using the National Topographic Database from Natural Resources Canada as the primary base, supplemented by many other federal, provincial and municipal datasets. We called it CanMap®, and it was the definitive Canadian base map for digital applications.

As our customers became more sophisticated in their use of the technology, there was a need to add more depth and precision to our maps. We added hundreds of layers of data to the street map fabric, including postal geography, electoral geography, 3 dimensional Digital Elevation Model (DEM) data and many others. We built a complete, seamless water layer for Canada, connecting all of the streams, lakes and rivers. For inter-modal transportation, we created a national rail network. For the mobile phone industry we created coast-to-coast clutter mapping for radio propagation analysis – which was used by telecommunications companies to deploy national cellular coverage. We built land use models, assembled demographics and built point of interest data.

And we called it CanMap 2.0

CanMap 2.0 set a new bar for location data excellence in the marketplace.

Others sought us out to build data for them and we built out over 10 million parcel boundaries for the U.S. for First American®.

A history of firsts

A fundamental tool for using location data efficiently is the geocoder. We were not happy with the quality of the available geocoders, so we set out to build our own. Based on our superior knowledge of Canadian geography and Canadian addresses we designed a solution that would make use of the high precision and extensive attribution of the CanMap base. Since Canada is bilingual we created a French-English geocoder, the first in the world.

To add greater precision we developed point level addresses – another first – and incorporated this data into the first point address geocoder.

By the time DMTI Spatial was 10 years old we had a huge catalogue of data products with thousands of variations. We began to combine our technology and data with others in new and different ways to create new hybrid products.

Thinking outside the box

Around this time we came up with a revolutionary new idea – why not combine the digital vector data such as our CanMap street maps with raster imagery – satellite and airborne – to create a new hybrid map/image? We approached Digital Globe and proposed a partnership – a co-branded product we called Satellite Streetview. Digital Globe was so impressed with this product that they started showing it around, and caught the attention of an internet search company. That company was Google™.

Our customers began to ask how were able to combine such large volumes of disparate data into one seamless database. They said that they had similar issues with their own data and wondered if we could help. To solve this problem we repurposed our internal data consolidation software and geocoding software, and Location Hub® was born.

A key innovation was the development and use of a persistent location ID – the Unique Address Identifier (UAID®), as a simple, elegant way to tie all data associated with a particular location to one unambiguous index key.

Based on the success of Location Hub and the UAID we then expanded this capability to embrace the wide world of 3rd party data. If we were able to stamp all incoming data records with a UAID, then any database processed through Location Hub would be instantly integrated with all other datasets processed through the Hub. And so the Location Economics Ecosystem was born.

What’s in store for 2015?

With all this data and processing power available in one software platform, the next logical step was to add analytics to the mix.  DMTI Spatial is getting ready to deploy a new Location-based analytics product this spring. It’s totally new to the spatial visualization field, is incredibly fast and efficient at profiling, requires very little data awareness and manipulation, and is geared to fit multiple verticals without breaking much of a sweat.

Building on our heritage of innovation and creativity, we continue will to help businesses grow through actionable insights uncovered by leveraging location to bring together and analyze a growing world of data. We will continue to make breakthrough products that change the way people use location.

~ John Fisher, Founder – DMTI Spatial

Click here to see how DMTI helps businesses throughout Canada leverage location technology.

Flood risk

Are Insurance Companies Measuring Flood Risk Accurately?

On Feb 19 2015, Aviva Canada announced the availability of overland water endorsement. This meant homeowner coverage in Ontario and Alberta would start in May, and roll out to additional provinces throughout 2015.

In Canada, we now have national flood hazard maps and the ability to easily map each of our policies.

“What gets measured, gets managed” – Peter Drucker

Data Visualization Tools for Flood Risk

Patrick Lundy (CEO) of Zurich Canada said:

“Having the right tools, maps and predictive models is key to charging an accurate price for the risk, and capacity in certain areas may become harder to come by. Updated flood zone maps for Canada are of the utmost importance in being able to respond accurately to the increased flooding activity.” (Canadian Underwriter, 2013)

Today, insurance organizations have the ability to:

  • Identify and assess significant exposures in their portfolio
  • Identify new business without growing their 1/n year flood loss
  • Determine where they should not write new business
  • Identify flood risk which may require a more detailed assessment

“Opportunities multiply as they are seized” – Sun Tzu

Insurance Bureau of Canada (IBC) identified that overland flooding is a risk, but this is for a small percentage of the population. This refers to those who live in floodplains or flood prone areas close to rivers or lakes.

Leveraging this knowledge may lead to the creation of a new niche product offering for overland flood.

“Once we know something, we find it hard to imagine what it was like not to know it” – Chip & Dan Heath, Authors of Made to Stick, Switch

The Real Flood Risk

Van Bakel of Crawford recalled discussions that insurance companies shouldn’t worry about catastrophic events, and that everything was accounted for internally.

Fast forward about six weeks. Two of the most populated areas of Canada would never flood within two weeks of each other, would they?”

Overland flood hazard maps and precise mapping (or geocoding) technology allows insurance companies to:

  • Understand the risk to your book of business
  • Identify which markets may have flood risk
  • Create new pricing models based on this risk
  • Generate new product revenue for the business

Click here to learn more about how your book of business may be impacted by overland flood in Canada, or contact us at info@dmtispatial.com.