


While some weather patterns are predictable, extreme weather events tend to run on their own calendar. Unfortunately, severe weather events have a tendency to cause the most damage and are occurring on a more frequent basis, resulting in a substantial financial impact on Canadian insurers. According to Catastrophe Indices and Quantification Inc. (CatIQ), in 2018 insured damage from severe weather events across Canada reached a staggering $1.9 billion.
Canada will no doubt continue to experience catastrophic weather events, but insurance professionals have solutions available that can help mitigate risks and reduce the financial impact of these events. Location Intelligence is an emerging field that provides substantial benefit to the insurance industry – from policy quote and approval processes through to claims management and customer service.
Advances in cloud computing are enabling insurers to migrate traditional geospatial analytics from an off-line manual process to real-time integrated solutions and automated workflows. Using location as a common point of reference, users are able to connect policy, property, claims and third-party data together to gain insight into the property and the surrounding area – allowing them to quickly analyze, visualize and assess property risk.
One common use case is the real-time, automated analysis of a proposed policy vs flood zones, earthquake zones and other potential perils. Getting a high precision view of where a property sits versus identified risks, allows for more accurate assessments. The availability of real-time location data offers two primary benefits. The first is increased productivity, delivered by automating assessments and consolidating the output on one screen so that agents can make better faster decisions. The second is proper pricing for the risk scenarios being proposed. The key to enabling these benefits is to empower the end user with information in real time.
While an agent is assessing the risk of a potential property, location data can answer a multitude of questions: Is this property exposed to a 1/20, 1/100, 1/200, or 1/1500 year flood event? What are the types and magnitude of historical claims in the surrounding area? Is my accumulation risk too high, or am I able to take on any more policies in this area? Are the current policies priced to cover identified risk? The answers to these questions are imperative when an insurer is trying to accurately calculate total risk exposure from perils and flooding, and accurately quote the policy in a timely manner.
While severe weather events and flooding will continue to present risks to Canadian insurers, access to real-time location data, including flood information, can enable insurers to make more informed decisions during the approval process. While the weather will continue to be unpredictable, location intelligence is a powerful tool to protect your bottom line.
To learn more read our White Paper: Mitigating Risk with Location Intelligence
Top 3 Ways Location Intelligence Empowers Underwriters

Territory management is a process that helps organizations by defining geographical territories based on factors such as sales, infrastructure locations and service delivery zones. Companies are managing this type of information today within spreadsheets and require a solution that helps build and visualize territories based on key metrics like revenue goals, market opportunities, custom client information, government areas, proximity to salespeople’s base location, etc.

Creating exceptional customer experience is becoming a top priority for many insurance providers as an essential way of differentiating themselves in a fiercely competitive marketplace. If you and your competitor offer similar pricing, but your competitor provides a better customer experience, who do you think will land the customer?
Location data offers actionable information that insurance providers can use to deliver high quality customer experiences at every touch point. Interested in using data to outpace your competition by offering stronger customer experiences? Check out these 5 hidden data points:
You want to ensure you’re offering the most accurate quotes possible when customers come to you seeking coverage. If you’re assessing risk based on postal codes, you aren’t working off of the most accurate location information, and this will be reflected in your pricing. Flooding and earthquakes, for example, don’t stop at the postal code boundary. It is more accurate to assess properties based on latitude, longitude, and elevation to truly understand risk.
Using a location intelligence platform like DMTI’s Location Hub, insurers can better identify and rate risks for properties of interest. Actionable information ensures underwriters make data-backed decisions based on the specific locations being reviewed. You get real-time, high precision geocoding delivered with trusted industry standards, and customers get pricing they can trust.
You cannot gain a true understanding of a property’s overall risk probability if you examine risks in silos. Location intelligence offers the ability to review total concentration of risk, such as flood, fire, and other natural hazards, and assess likelihood of any of these occurring, as well as how close the property is to emergency services.
Here’s how this improves your customer’s experience. Aside from providing customers with fair, accurate pricing, you also have a comprehensive understanding of their exact insurance needs, including needs they may not realize they have. For example, a customer coming to you for property insurance may not realize they also require coverage for wildfire or flooding. Using location intelligence, you’ve got the data to show customers what they need, making them feel confident in your services and completely protected by the coverage you offer.
Time Average processing time for quotes and claims is an essential data point every insurance provider must be aware of. Most people are accustomed to immediate gratification, and staying competitive in the insurance industry requires providers to deliver information quickly.
Leveraging the right digital tools is the key to tracking and reducing processing time. Location intelligence easily feeds into platforms that automate the underwriting and claims process according to your company’s rules and guidelines.
Location Intelligence platforms enable customer data to be seamlessly integrated, allowing you to autofill information and limit the number of manual inputs required when generating quotes. Automation of personal information reduces costs for you, while providing customers with a better digital experience. Location intelligence also allows you to review customer claims patterns for real time data-based decision making throughout the underwriting process.
Instant access to customers’ portfolios provides an overview of data revealing areas where your insurance company could offer additional services. For example, if you’re using a location intelligence platform, you’ll be able to see all properties owned by a customer that may be covered by other insurance providers. With complete property information paired with hazard data, you’ll also be able to see if your customer has adequate coverage to fully protect their assets. This data allows you to provide a great experience for customers because you enter conversations prepared with complete information and options to provide better rates and coverage than your competition.
Click here to learn more.

Fraud represents a multi-billion dollar problem for the banking and insurance industry in Canada. Location intelligence and analytics can add a powerful dimension to help manage fraud.
The growing complexity of fraud and well-executed rings have exposed the limitations of traditional detection systems, such as red flag indicators, investigations based on manual observations, internal audits findings, and software that shows anomalies based on a pre-defined set of business rules. In order to address fraud, organizations are becoming more proactive and sophisticated in their approach to data and information. In particular, data analytics and predictive modeling are allowing insurers to uncover complex, organized fraud activities using both structured and unstructured data.
Although location intelligence and analytics represent a key piece of the fraud puzzle, traditionally they have been overlooked or vastly underutilized. Geospatial analytics tools provide access to a rich library of address-related content including name and phone number, demographics, firmographics, Canadian flood data, environmental risk information, land use information, earthquake boundaries and more, and can help unlock useful information and allow insurers to connect the dots on previously hidden fraud schemes.
Accurate geo-coding can also help verify the claim location. There are several technology companies looking to improve field documentation and workflows for P&C insurers and claims professionals that use geo tagging and time stamping to determine the authenticity of information of property claims in an exact geographic coordinate. Was the claim in an area where a significant loss event, such as flooding, actually occurred? Geospatial analysis can be used to identify the exact area affected by a natural disaster, which helps determine the amount of risk to insured properties and weed out claims that are filed from areas not located in the affected zone.
This could involve, as an example, a spate of hail damage claims in a particular area. An insurance company can quickly pinpoint the exact geographic coordinates of the claim in real-time and overlay the storm’s path over that location. Was the claim location actually affected by the storm, or is it outside the boundaries (or marginal)? In large loss events, insurance companies often experience claims ‘leakage’ – when claims payouts are more than the terms set out in the policy. Precise use of location intelligence can help stop the leakage of opportunistic claims, or ‘soft fraud’. Location intelligence can help with more than just catastrophic events. There may be, as an example, a series of small, but costly kitchen fires in a certain neighborhood. Is this just an anomaly or is it neighbors’ talking over the fence about how small fires can lead to full kitchen replacement costs? With location intelligence, this cluster can be flagged for follow up investigation.
With the inherent accuracy provided by geocoding and the analytic capabilities afforded from a vast number of inputs, location intelligence is a powerful tool for managing fraud and risk mitigation. Organizations that build location intelligence into their business strategy will undoubtedly have a competitive advantage through better risk management, visual diagnostics related to geography, and on-demand access to a wealth of location- based information and assets.
To learn more, read our Mitigating Risk with Location Intelligence white paper.

Condo popularity is on the rise and for those financing the properties, whether it be a reputable financial institution or the bank of mom and Dad, is your investment protected? What happens in the event of a flood and are you asking all of the right questions before investing? For example, are you investing in properties that are a high risk to flood? With help from DMTI, we’re able to take a closer look on a few regions to understand your exposure.
What risk does flood pose in Canada?
Floods are the most frequently occurring natural hazard in Canada. According to the Institute for Catastrophic Loss Reduction (ICLR), the Canadian Disaster Database indicates that 241 flood disasters have occurred in Canada between the years 1900 and 2005, almost five times as many as the next most common disaster (wildfire). Over the past few decades, urban flooding has been a growing problem, resulting in more than $20 billion in flood damage between 2003 and 2012, according to the federal government.
What is the risk of flood peril to condos in Canada?
In order to provide answers to this question, a condominium database for Canada was created by Teranet and DMTI Spatial combined with flood hazard maps highlighting areas that could be impacted by river flood (where the water rises over its banks), surface water (where water will pool due to elevation differences) and storm surge (coastal flooding). Three key markets were focused on as part of this analysis: Toronto, Vancouver and Montreal.
Toronto, ON
The flood risk analysis (using 1/100 year return period) for Toronto revealed that approx. 1.2% of all condo buildings may be impacted by river flood risk and approx. 5.9% of all condo buildings may be impacted by surface water flood risk.
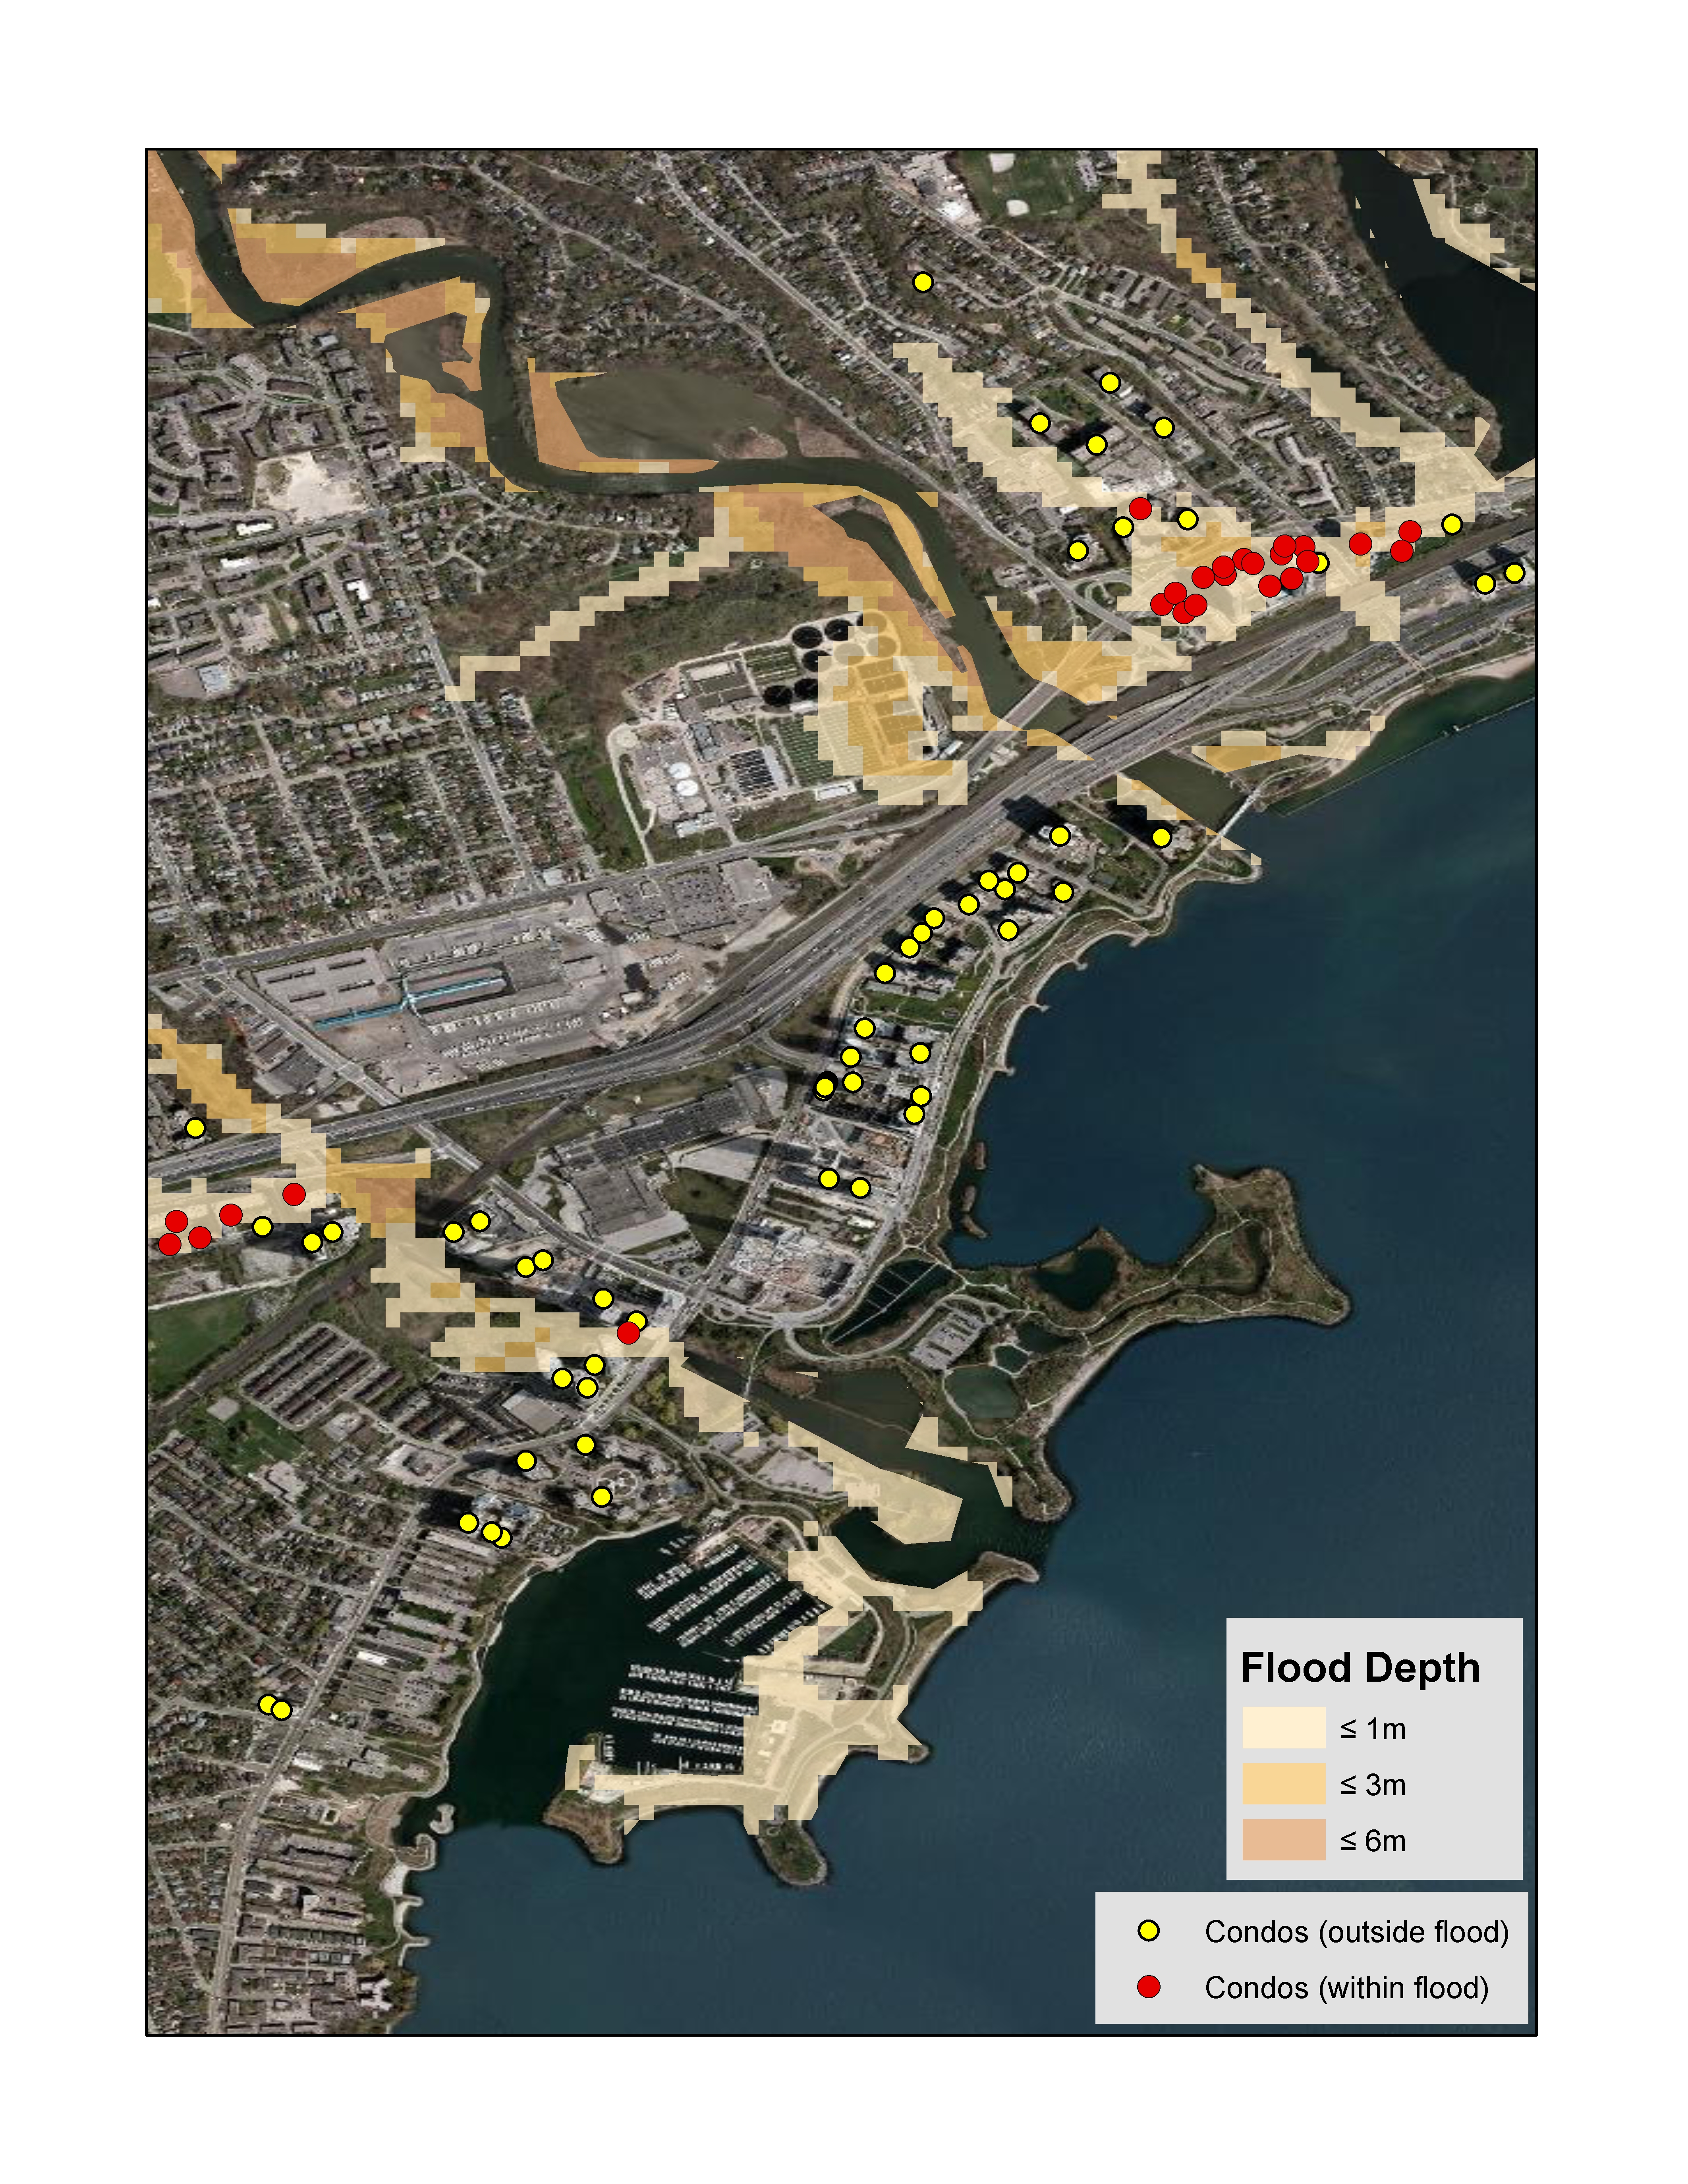
Toronto
Figure #1: Toronto, Ontario – Condos falling within the river flood hazard map for the 1/100 year return period.
Vancouver, BC
The flood risk analysis (using the 1/100 year return period) in Vancouver revealed that approx. 7.3% of all condo buildings may be impacted by surface water risk and approx. 3.2% of all condo buildings may be impacted by storm surge flood risk
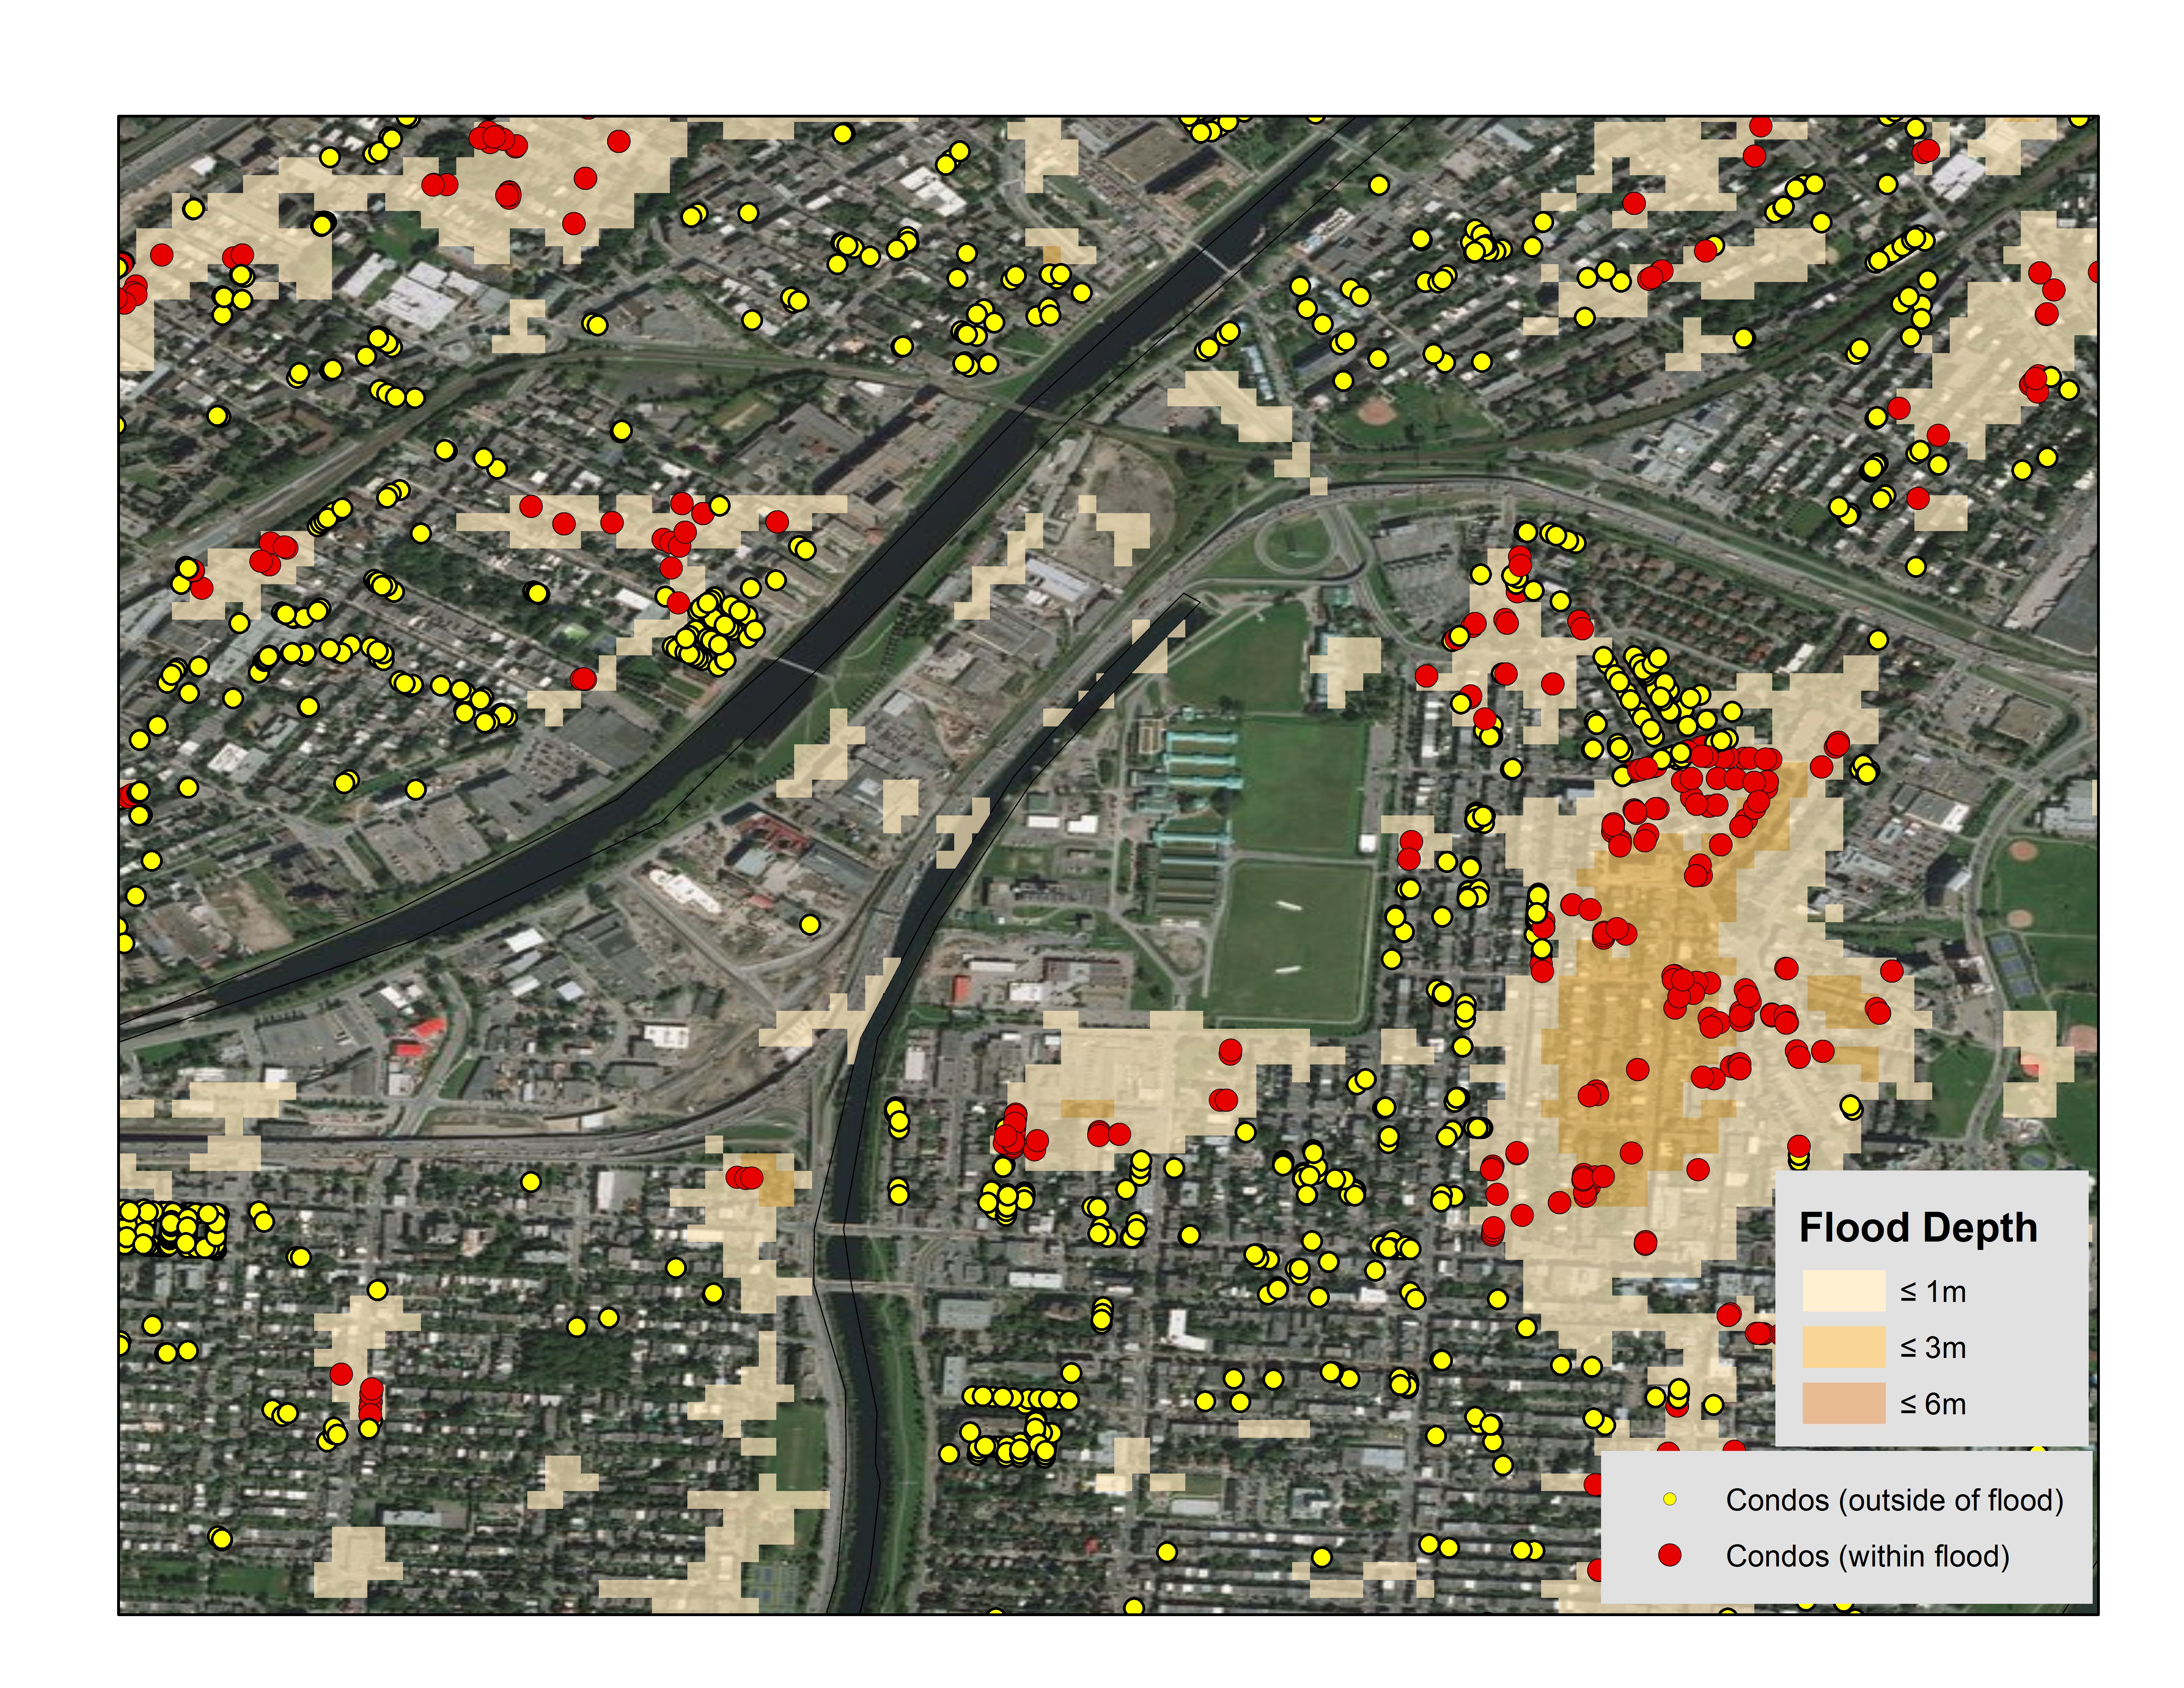
Figure 2: Vancouver, British Columbia – Condos falling within the surface water hazard map for the 1/100 year return period
Montreal, QC
The flood analysis (using the 1/100 year return period) in Toronto revealed that approx. 15.0% of all condo buildings may be impacted by river flood risk and approx. 11.4% of all condo buildings may be impacted by surface water flood risk.
Figure 3: Montreal, Quebec – Condos falling within the surface water hazard map for the 1/100 year return period
What does this mean to my business?
As per the Insurance Bureau of Canada (IBC) for flood perils, 20% of Canadian households could be qualified as high risk, and about 10% of those would be considered very high risk which equates to about 1.8 million households. Understanding the impact of natural disasters such as catastrophic flooding is a complex issue. Many customers are challenged with identifying and mitigating their total risk and exposure within their existing portfolio. Here are some additional areas for consideration that would benefit from this type of analysis:
The analysis conducted by DMTI Spatial using its platform Location Hub supports real-time flood risk analysis, portfolio accumulation risk analysis and the real-time visualization of the potential exposure to flood zones. This provides key data of importance to better forecast exposure and mitigate risk.
Contact us to learn more