Posts

Mitigating Flood Risk with Location Intelligence

While some weather patterns are predictable, extreme weather events tend to run on their own calendar. Unfortunately, severe weather events have a tendency to cause the most damage and are occurring on a more frequent basis, resulting in a substantial financial impact on Canadian insurers.   According to Catastrophe Indices and Quantification Inc. (CatIQ), in 2018 insured damage from severe weather events across Canada reached a staggering $1.9 billion.

Canada will no doubt continue to experience catastrophic weather events, but insurance professionals have solutions available that can help mitigate risks and reduce the financial impact of these events.  Location Intelligence is an emerging field that provides substantial benefit to the insurance industry – from policy quote and approval processes through to claims management and customer service.

Advances in cloud computing are enabling insurers to migrate traditional geospatial analytics from an off-line manual process to real-time integrated solutions and automated workflows.  Using location as a common point of reference, users are able to connect policy, property, claims and third-party data together to gain insight into the property and the surrounding area – allowing them to quickly analyze, visualize and assess property risk.

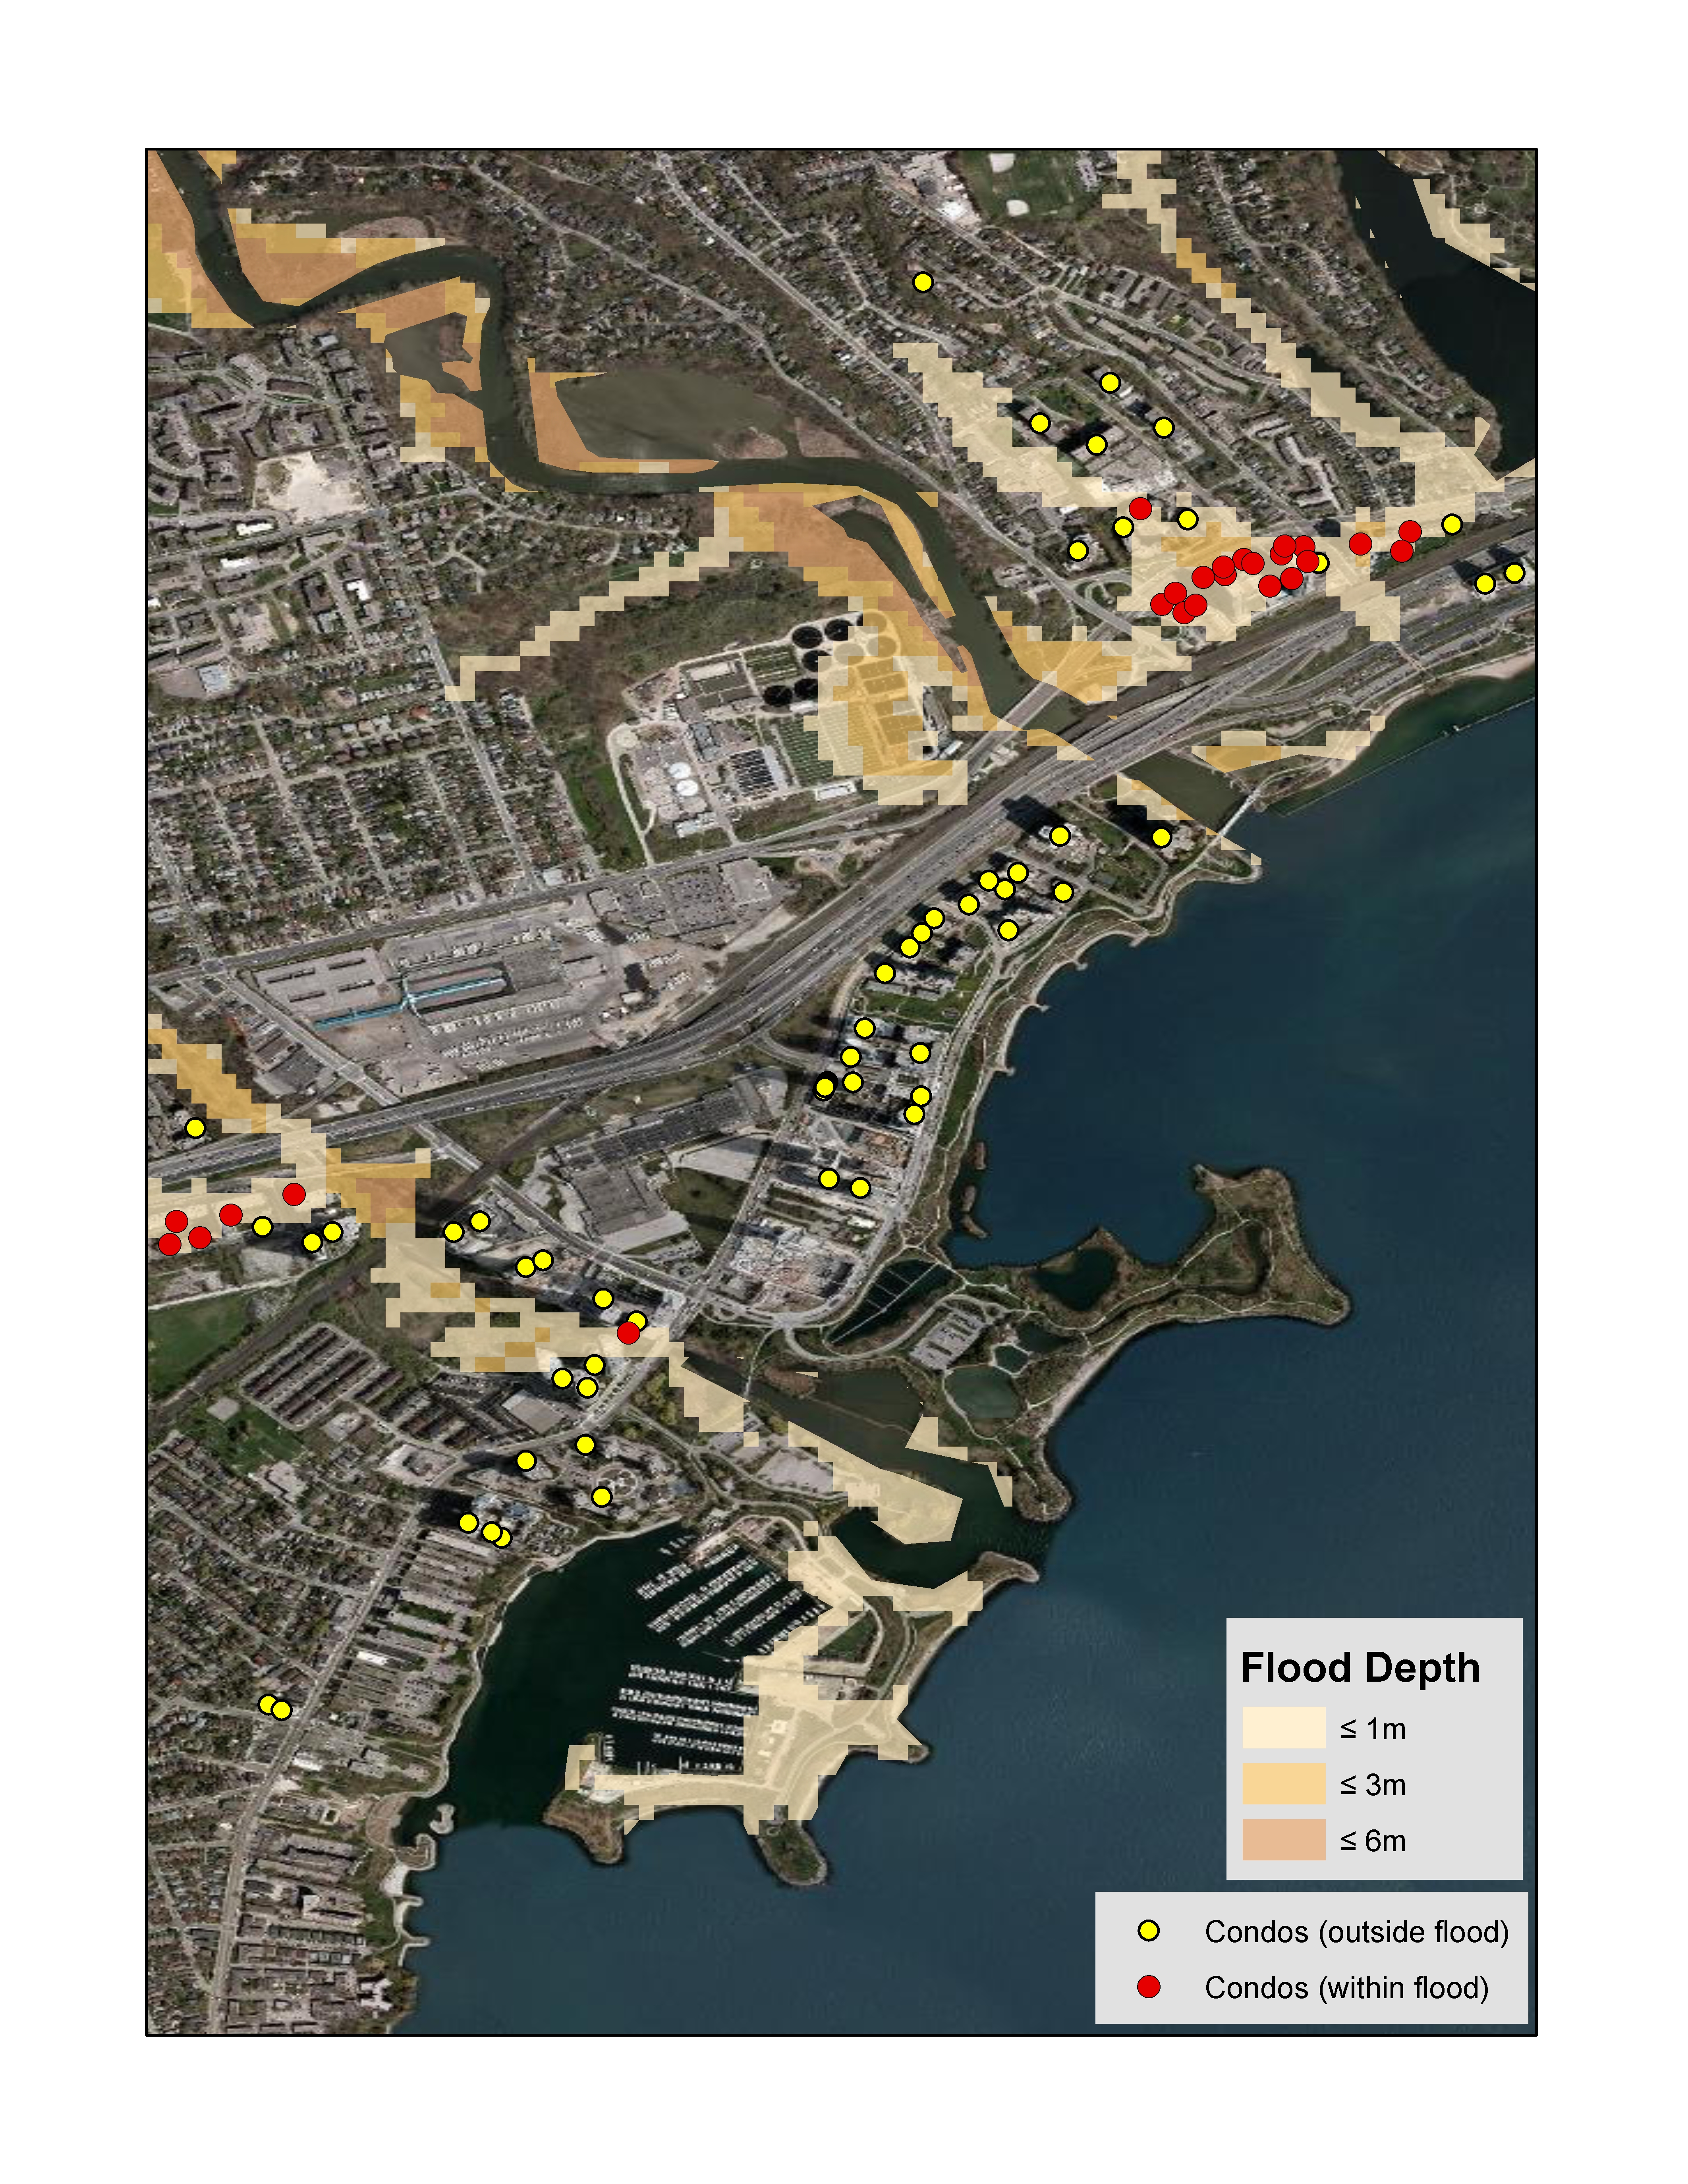
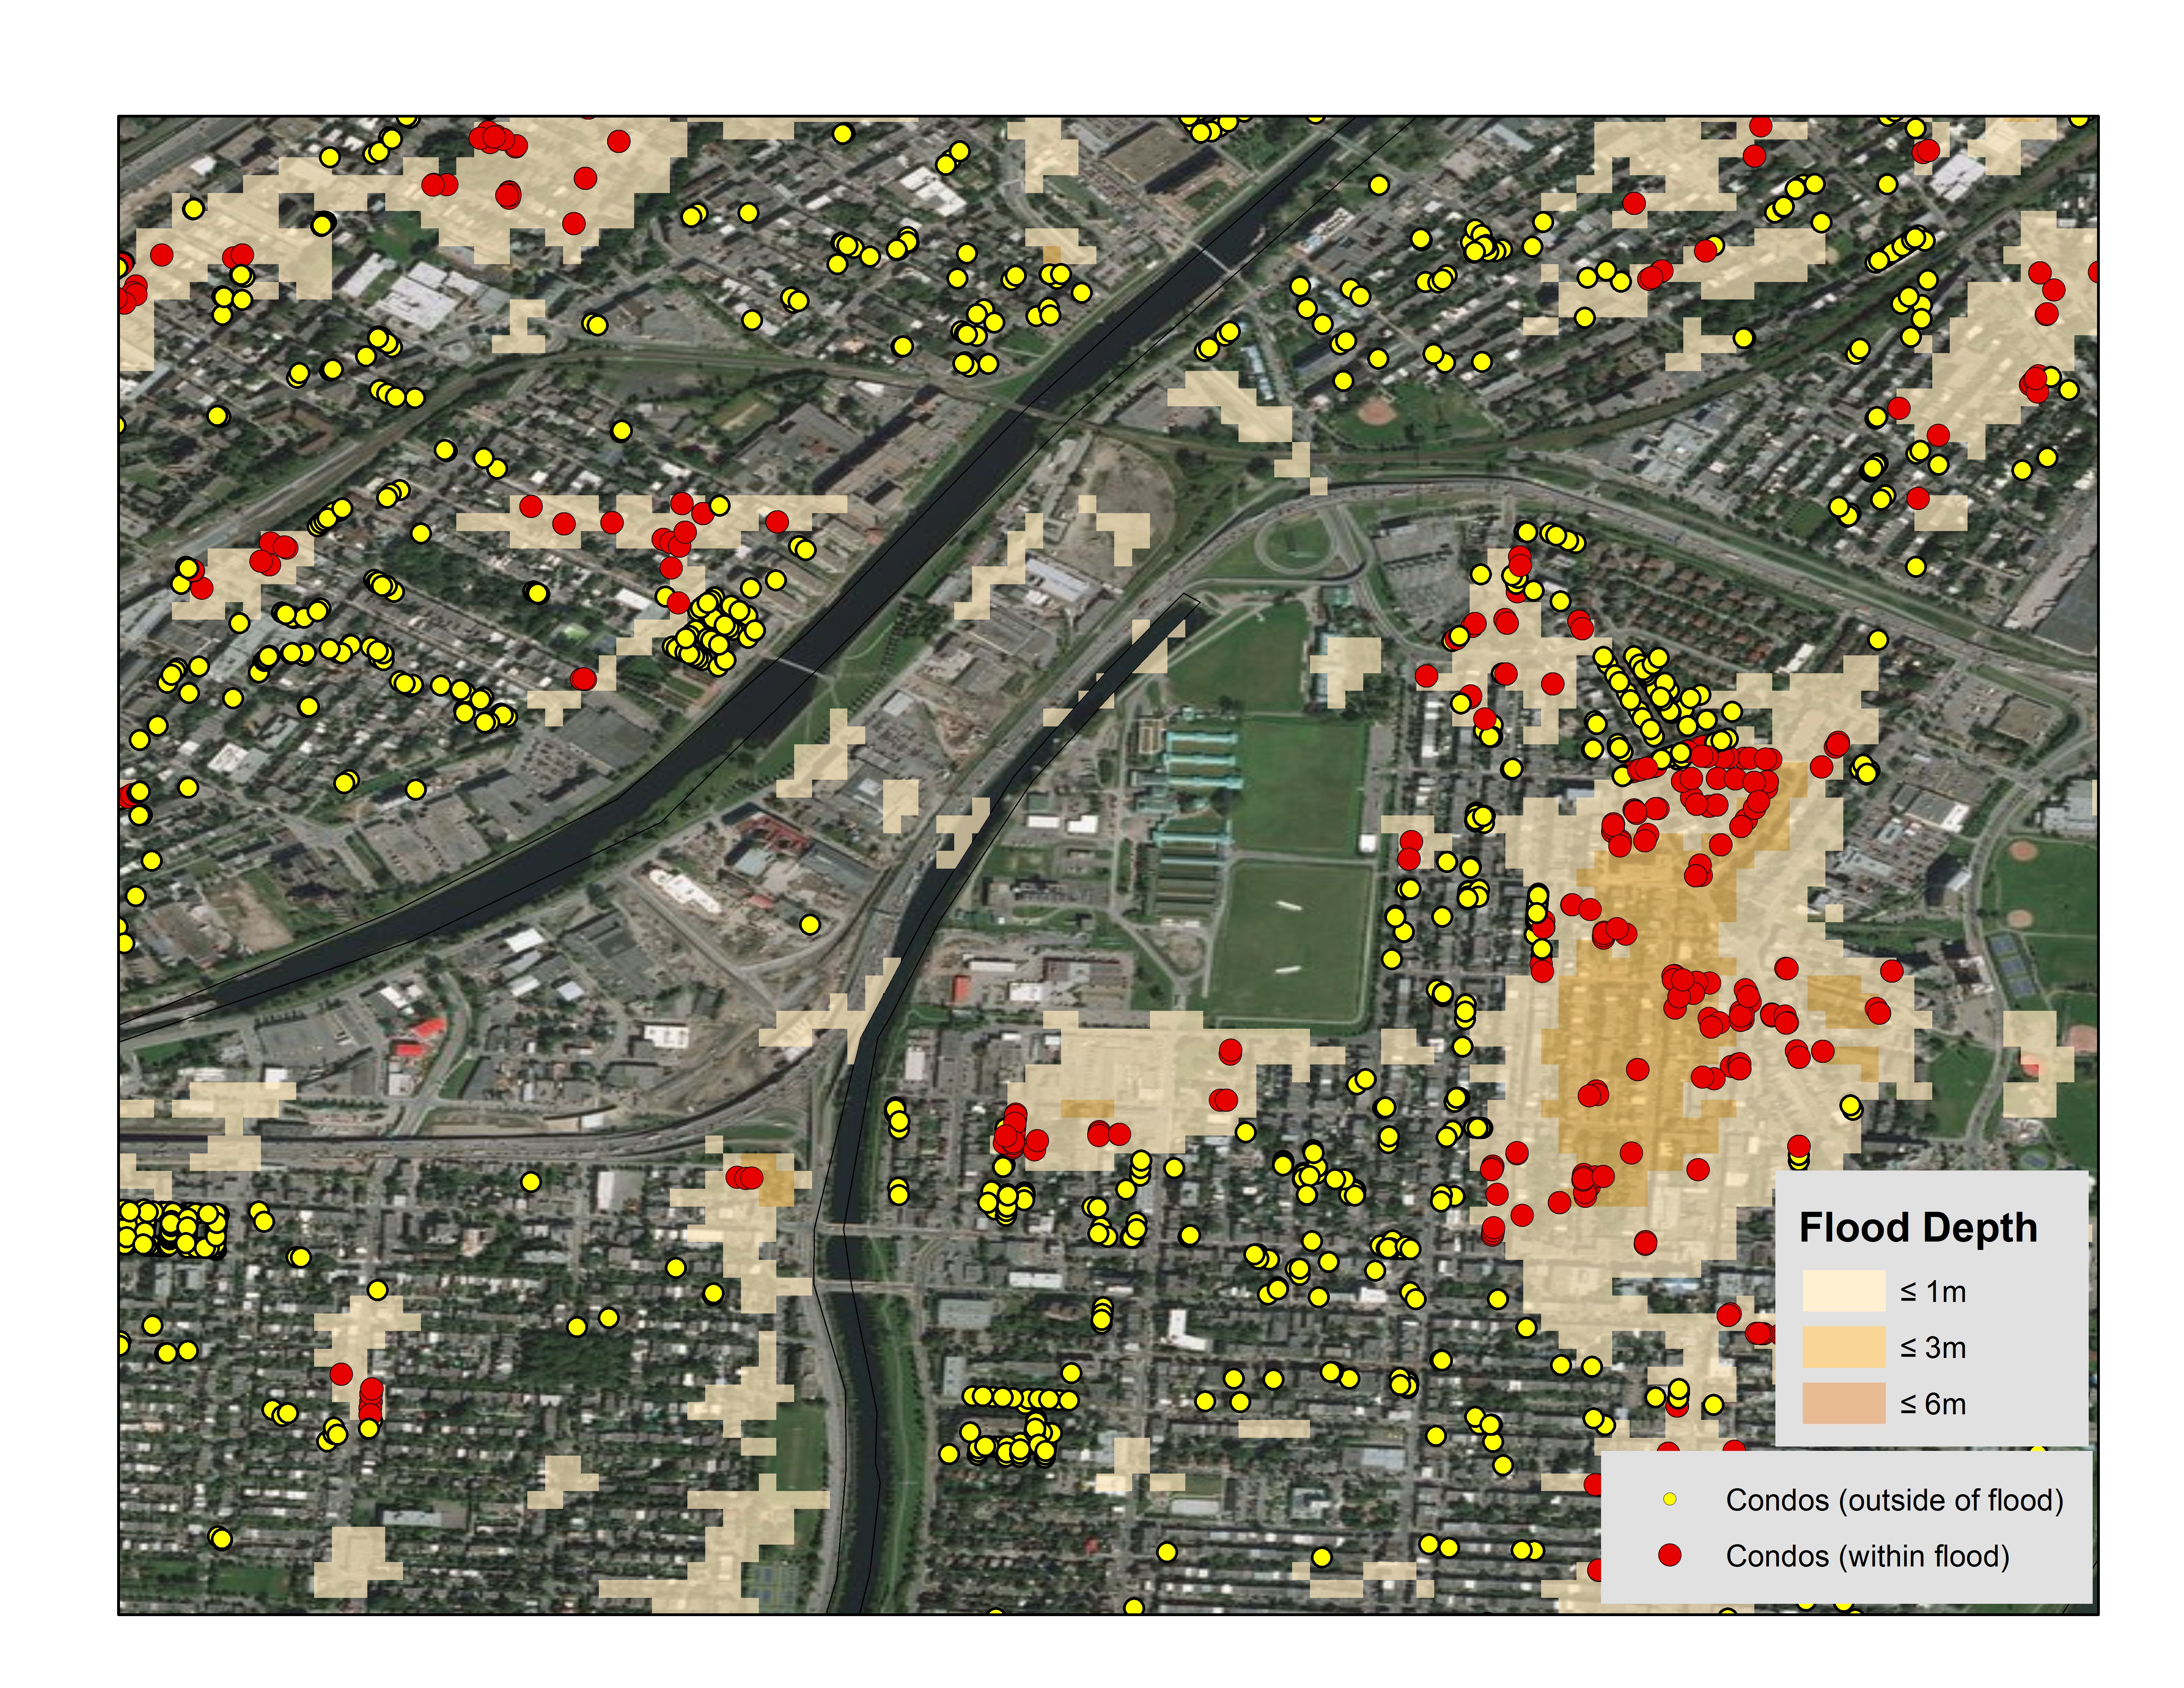
One common use case is the real-time, automated analysis of a proposed policy vs flood zones, earthquake zones and other potential perils.  Getting a high precision view of where a property sits versus identified risks, allows for more accurate assessments. The availability of real-time location data offers two primary benefits.  The first is increased productivity, delivered by automating assessments and consolidating the output on one screen so that agents can make better faster decisions.  The second is proper pricing for the risk scenarios being proposed.  The key to enabling these benefits is to empower the end user with information in real time.

While an agent is assessing the risk of a potential property, location data can answer a multitude of questions: Is this property exposed to a 1/20, 1/100, 1/200, or 1/1500 year flood event? What are the types and magnitude of historical claims in the surrounding area? Is my accumulation risk too high, or am I able to take on any more policies in this area? Are the current policies priced to cover identified risk? The answers to these questions are imperative when an insurer is trying to accurately calculate total risk exposure from perils and flooding, and accurately quote the policy in a timely manner.

While severe weather events and flooding will continue to present risks to Canadian insurers, access to real-time location data, including flood information, can enable insurers to make more informed decisions during the approval process. While the weather will continue to be unpredictable, location intelligence is a powerful tool to protect your bottom line.

To learn more read our White Paper:  Mitigating Risk with Location Intelligence


Additional Reading:

Top 3 Ways Location Intelligence Empowers Underwriters


Flood Data and Location Intelligence

Leveraging Flood Analysis to Mitigate Risk

Condo popularity is on the rise and for those financing the properties, whether it be a reputable financial institution or the bank of mom and Dad, is your investment protected? What happens in the event of a flood and are you asking all of the right questions before investing? For example, are you investing in properties that are a high risk to flood? With help from DMTI, we’re able to take a closer look on a few regions to understand your exposure.

What risk does flood pose in Canada?

Floods are the most frequently occurring natural hazard in Canada. According to the Institute for Catastrophic Loss Reduction (ICLR), the Canadian Disaster Database indicates that 241 flood disasters have occurred in Canada between the years 1900 and 2005, almost five times as many as the next most common disaster (wildfire). Over the past few decades, urban flooding has been a growing problem, resulting in more than $20 billion in flood damage between 2003 and 2012, according to the federal government.

What is the risk of flood peril to condos in Canada?

In order to provide answers to this question, a condominium database for Canada was created by Teranet and DMTI Spatial combined with flood hazard maps highlighting areas that could be impacted by river flood (where the water rises over its banks), surface water (where water will pool due to elevation differences) and storm surge (coastal flooding). Three key markets were focused on as part of this analysis: Toronto, Vancouver and Montreal.

Toronto, ON

The flood risk analysis (using 1/100 year return period) for Toronto revealed that approx. 1.2% of all condo buildings may be impacted by river flood risk and approx. 5.9% of all condo buildings may be impacted by surface water flood risk.

Toronto

Toronto

Figure #1: Toronto, Ontario – Condos falling within the river flood hazard map for the 1/100 year return period.

Vancouver, BC

The flood risk analysis (using the 1/100 year return period) in Vancouver revealed that approx. 7.3% of all condo buildings may be impacted by surface water risk and approx. 3.2% of all condo buildings may be impacted by storm surge flood risk

Figure 2: Vancouver, British Columbia – Condos falling within the surface water hazard map for the 1/100 year return period

Montreal, QC

The flood analysis (using the 1/100 year return period) in Toronto revealed that approx. 15.0% of all condo buildings may be impacted by river flood risk and approx. 11.4% of all condo buildings may be impacted by surface water flood risk.

Figure 3: Montreal, Quebec – Condos falling within the surface water hazard map for the 1/100 year return period

What does this mean to my business?

As per the Insurance Bureau of Canada (IBC) for flood perils, 20% of Canadian households could be qualified as high risk, and about 10% of those would be considered very high risk which equates to about 1.8 million households. Understanding the impact of natural disasters such as catastrophic flooding is a complex issue. Many customers are challenged with identifying and mitigating their total risk and exposure within their existing portfolio. Here are some additional areas for consideration that would benefit from this type of analysis:

  • Risk Mitigation: Enhance real-time mortgage adjudication processes, speed time to decision and reduce manual intervention with enhanced insight into the precise location of the property as it relates to a flood zone.
  • Risk Analysis: Validate capital adequacy requirements and better understand and reduce exposure by being able to assess the total accumulated risk to a portfolio as it relates to proximity within flood plains.
  • Site Planning: Enhance infrastructure and site planning analysis by understanding the potential risk of flood before deployment.

The analysis conducted by DMTI Spatial using its platform Location Hub supports real-time flood risk analysis, portfolio accumulation risk analysis and the real-time visualization of the potential exposure to flood zones. This provides key data of importance to better forecast exposure and mitigate risk.

Contact us to learn more

Flood risk

Are Insurance Companies Measuring Flood Risk Accurately?

On Feb 19 2015, Aviva Canada announced the availability of overland water endorsement. This meant homeowner coverage in Ontario and Alberta would start in May, and roll out to additional provinces throughout 2015.

In Canada, we now have national flood hazard maps and the ability to easily map each of our policies.

“What gets measured, gets managed” – Peter Drucker

Data Visualization Tools for Flood Risk

Patrick Lundy (CEO) of Zurich Canada said:

“Having the right tools, maps and predictive models is key to charging an accurate price for the risk, and capacity in certain areas may become harder to come by. Updated flood zone maps for Canada are of the utmost importance in being able to respond accurately to the increased flooding activity.” (Canadian Underwriter, 2013)

Today, insurance organizations have the ability to:

  • Identify and assess significant exposures in their portfolio
  • Identify new business without growing their 1/n year flood loss
  • Determine where they should not write new business
  • Identify flood risk which may require a more detailed assessment

“Opportunities multiply as they are seized” – Sun Tzu

Insurance Bureau of Canada (IBC) identified that overland flooding is a risk, but this is for a small percentage of the population. This refers to those who live in floodplains or flood prone areas close to rivers or lakes.

Leveraging this knowledge may lead to the creation of a new niche product offering for overland flood.

“Once we know something, we find it hard to imagine what it was like not to know it” – Chip & Dan Heath, Authors of Made to Stick, Switch

The Real Flood Risk

Van Bakel of Crawford recalled discussions that insurance companies shouldn’t worry about catastrophic events, and that everything was accounted for internally.

Fast forward about six weeks. Two of the most populated areas of Canada would never flood within two weeks of each other, would they?”

Overland flood hazard maps and precise mapping (or geocoding) technology allows insurance companies to:

  • Understand the risk to your book of business
  • Identify which markets may have flood risk
  • Create new pricing models based on this risk
  • Generate new product revenue for the business

Click here to learn more about how your book of business may be impacted by overland flood in Canada, or contact us at info@dmtispatial.com.


Canadian Flood Data

Are ‘inadequate’ flood-hazard maps impacting your business?

The flood-hazard maps currently available for Calgary are inadequate, according to a recent Calgary Herald article.  Hundreds of properties outside of the designated 1/100 year flood plain were impacted during the Alberta flood event of 2013.  Canada experienced the costliest and third-costliest disasters in Canadian history within two weeks of each other in 2013.  This past summer has also seen its share of flooding. The Insurance Bureau of Canada (IBC) estimated insured damage from summer flooding in the Prairies at $60 million.

The Institute for Catastrophic Loss Reduction (ICLR) advocates for the implementation of the recommendations made from the Alberta provincial reportProvincial Flood Mitigation Report: Consultation and Recommendation.”  Flood risk maps are needed to identify urban flood risk areas.

Effective Disaster Risk Management for Insurance Companies

Disaster risk management is crucial. The following for flood-hazard maps should be considered, in addition to the recommendations above:

  • Use multiple flood-hazard return periods (1/20, 1/100, 1/200 and 1/1,500 year) for analysis
  • Ensure flood-hazard data is regularly assessed and maintained annually
  • Integrate flood-hazard data and location services into your on-line underwriting applications to get real-time access to proximity to flood and water features
  • Access address level services that provide risk related information
  • Assess your accumulated risk based on location of properties within the 1/20, 1/100, 1/200 and 1/1,500 year flood zones.

What about flood maps for Canada?

A national file of flood-hazard maps for Canada will allow you to understand the risk associated with one address or your entire portfolio.

For insurers, this data allows you to get the answers to imperative questions such as:

  • Exposures to your portfolio
  • Where to write new business without growing your 1/n year flood loss
  • Accurately rate policies based on the potential risk of flood
  • Where not to write new business
  • Identifying areas that may have a potential flood risk that may require further assessment

Learn more about how to take advantage of vital flood information that can be used in real-time transactional risk analysis. Click here to learn more about how DMTI provides Insurance Providers with accurate information.