Leveraging Flood Analysis to Mitigate Risk
Condo popularity is on the rise and for those financing the properties, whether it be a reputable financial institution or the bank of mom and Dad, is your investment protected? What happens in the event of a flood and are you asking all of the right questions before investing? For example, are you investing in properties that are a high risk to flood? With help from DMTI, we’re able to take a closer look on a few regions to understand your exposure.
What risk does flood pose in Canada?
Floods are the most frequently occurring natural hazard in Canada. According to the Institute for Catastrophic Loss Reduction (ICLR), the Canadian Disaster Database indicates that 241 flood disasters have occurred in Canada between the years 1900 and 2005, almost five times as many as the next most common disaster (wildfire). Over the past few decades, urban flooding has been a growing problem, resulting in more than $20 billion in flood damage between 2003 and 2012, according to the federal government.
What is the risk of flood peril to condos in Canada?
In order to provide answers to this question, a condominium database for Canada was created by Teranet and DMTI Spatial combined with flood hazard maps highlighting areas that could be impacted by river flood (where the water rises over its banks), surface water (where water will pool due to elevation differences) and storm surge (coastal flooding). Three key markets were focused on as part of this analysis: Toronto, Vancouver and Montreal.
Toronto, ON
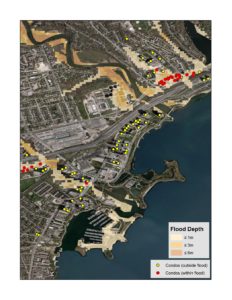
The flood risk analysis (using 1/100 year return period) for Toronto revealed that approx. 1.2% of all condo buildings may be impacted by river flood risk and approx. 5.9% of all condo buildings may be impacted by surface water flood risk.
Figure #1: Toronto, Ontario – Condos falling within the river flood hazard map for the 1/100 year return period.
Vancouver, BC
The flood risk analysis (using the 1/100 year return period) in Vancouver revealed that approx. 7.3% of all condo buildings may be impacted by surface water risk and approx. 3.2% of all condo buildings may be impacted by storm surge flood risk
Figure 2: Vancouver, British Columbia – Condos falling within the surface water hazard map for the 1/100 year return period
Montreal, QC
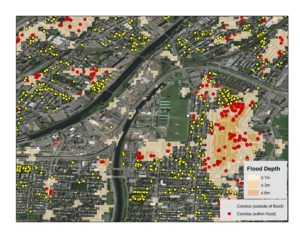
The flood analysis (using the 1/100 year return period) in Toronto revealed that approx. 15.0% of all condo buildings may be impacted by river flood risk and approx. 11.4% of all condo buildings may be impacted by surface water flood risk.
Figure 3: Montreal, Quebec – Condos falling within the surface water hazard map for the 1/100 year return period
What does this mean to my business?
As per the Insurance Bureau of Canada (IBC) for flood perils, 20% of Canadian households could be qualified as high risk, and about 10% of those would be considered very high risk which equates to about 1.8 million households. Understanding the impact of natural disasters such as catastrophic flooding is a complex issue. Many customers are challenged with identifying and mitigating their total risk and exposure within their existing portfolio. Here are some additional areas for consideration that would benefit from this type of analysis:
- Risk Mitigation: Enhance real-time mortgage adjudication processes, speed time to decision and reduce manual intervention with enhanced insight into the precise location of the property as it relates to a flood zone.
- Risk Analysis: Validate capital adequacy requirements and better understand and reduce exposure by being able to assess the total accumulated risk to a portfolio as it relates to proximity within flood plains.
- Site Planning: Enhance infrastructure and site planning analysis by understanding the potential risk of flood before deployment.
The analysis conducted by DMTI Spatial using its platform Location Hub supports real-time flood risk analysis, portfolio accumulation risk analysis and the real-time visualization of the potential exposure to flood zones. This provides key data of importance to better forecast exposure and mitigate risk.
Contact us to learn more


