Customer Experience

How Spatial Technology is Transforming Customer Experiences in the Insurance Industry

Using Spatial Technology to Improve the Customer Experience in the Insurance Industry…While Increasing Profits

Customer experience in the insurance industry is a hot topic, and it’s easy to see why. A strong customer experience is the key to growth and profitability, requiring many companies to focus on differentiating their customer experience to stay ahead of the competition. However, despite the obvious benefits of cultivating happy customers, many insurance providers struggle with how to deliver a great customer experience and increase profits.

You must find ways to maintain the integrity of your business alongside ways to serve customers better – because if you don’t someone else will. In a 2016 letter to his shareholders, Amazon CEO Jeff Bezos explained that being customer-centric is about staying ahead of customers and developing new ways to keep them happy. Bezos says that if you shift your focus from trying to create great customer experiences, then you’re already on your way down.

Insurance providers are concerned that providing better customer experiences could conflict with the established rules and processes they’ve developed for risk selection and pricing. This certainly doesn’t have to be the case. The solution is using a spatial technology platform that supports and strengthens existing workflows while helping develop meaningful digital experiences for customers.

Digital Customer Experience in the Insurance Industry

In today’s tech-enabled world, your customer’s digital experience plays a huge role in how they perceive your company. Your website is often a customer’s first touch-point with your company and will be the first time they assess if you can meet their needs. Studies show you’ve got less than 1 minute to convince website visitors whether or not they should try your product or service. In insurance, that translates to showing customers they can expect fair pricing and an efficient turnaround time.

That’s where your spatial technology platform comes in.

Use Spatial Technology to Deliver What Customers Want

People expect online experiences to be simple and intuitive and they are accustomed to instantly accessing the information they want. In the insurance industry, providing a great customer experience means being able to quickly deliver information or a plan for coverage. Leveraging a spatial technology platform enables automation and self-service, making the process of generating insurance quotes and pricing simple, fast and efficient.

More and more insurance companies are experiencing the transformative effects of automation, including improved accuracy and efficiency. Data gathered by customer inputs can be automatically delivered into your underwriting process, and remain consistent with the risk selection and pricing models developed by your company’s actuarial/risk group. A well-defined process can easily interface with a spatial technology platform to automate inputs for calculation resulting in instant assessment and pricing.

Spatial technology platforms deliver location-based insights, including tools like geocoding, digital mapping, data analytics and visual dashboards, helping insurers use location intelligence throughout the policy lifecycle to deliver on client needs without sacrificing profitability. Using automated workflows, your spatial technology platform will geocode addresses in real time providing high precision coordinates, and automatically cross reference this data with the appropriate risk factors within your risk assessment models and pricing engine.

In addition to improving profitability by streamlining customer’s access to plans and policies, spatial data paired with customer information can also be used to assess additional plans that consumers may not realize they could benefit from, therefore offering ample opportunity for your company to cross-sell or upsell additional plans and features.

Using Spatial Intelligence to Improve Risk Assessment and Pricing

A strong spatial technology platform provides the location-based insights and analytics necessary to support underwriting, exposure management and claims. This data allows you to improve auditability with defined automated rules and quickly aggregate and visualize location information for more effective and accurate analysis when determining risk.

Real time location intelligence helps insurers quickly respond to policy applications, catastrophic events, and claims with greater accuracy. The ability to apply geographic coordinates (geocoding) to the property of interest offers insurers the ability to associate complex data sets with those coordinates, enabling deeper insights on concentration risk and exposure to hazards. This includes earthquakes, flooding, windstorms and more. These insights can better enable no-touch, low-touch adjudication processes, or provide better insights through visualization for exception handling or portfolio risk analysis.

Finally, the data on a strong spatial technology platform is continually updated to reflect the most current, precise location data, improving risk assessment to ensure accurate pricing.

DMTI Helps Insurance Companies Improve the Customer Experience

When it comes to developing a great customer experience in the insurance industry, it’s important to keep things simple. Companies now have the tools to gather data on what customers want and need to keep them happy, loyal to your brand, and refer you to other potential customers. Using spatial technology, you can manage and monitor risk exposure in real time, with complete location data on one platform.

DMTI is the gold standard for GIS and location-based data in Canada, offering insurers scalable on-demand tools that support real time workflows. DMTI Spatial’s Location Hub® & UAID® is the only solution of its kind in Canada, and supports you company’s risk assessment process by delivering data visualization tools, and data delivery infrastructure to provide high-precision location accuracy.

Click here to find out how DMTI will help your insurance company experience greater growth and profitability.

Underwriters DMTI Spatial CanMap Canadian GIS Data

Top 3 Ways Location Intelligence Empowers Underwriters

Today, modern location intelligence solutions are transforming the underwriting process. They give front line underwriters the ability to quickly and intuitively understand the exposures associated with one address – or an entire portfolio. Geospatial analysis has evolved from a back-office, ‘after the-fact’ function to a leading role in real-time underwriting decisions. Below are the top 3 ways Location Intelligence empowers Underwriting.

1) Individual Risk Assessment and Pricing 

True location intelligence solutions allows underwriters to more accurately assess risk at the individual property level, resulting in higher quality underwriting, more profitable business and cost savings through reduced claims.

Proper risk assessment starts at the point of sale. In the case of personal and commercial properties, that involves the validation and cleansing of addresses. Location intelligence solutions allow insurers to quickly validate the accuracy of new addresses or addresses currently on file for existing policyholders.

2) Risk Accumulation and Portfolio Management 

Accumulation or concentration of risk is an ongoing concern for insurance companies. An accumulation of risk occurs when a portfolio of business contains a concentration of risks that might give rise to exceptionally large losses from a single event. Such an accumulation might occur by location (property insurance) or occupation (employers’ liability insurance), for example.

Insurance underwriters require real-time visibility into their policy accumulations, perils risk data and claims history across their book of business. With an aggregated view of risk (perils and accumulations), underwriters can better manage their overall exposure across their entire portfolio.

Location intelligence solutions offer an accumulation and perils management tool to analyze various risk levels against individual addresses, street levels and postal codes to produce hazard ratings. This means underwriters can make decisions using up to-date data, such as flood or earthquake risk, contaminated land or proximity to potential risk sites, such as gas or propane storage facilities

3)  Segmentation 

A powerful result of location intelligence technology for underwriters is segmentation. Instead of looking at risks on a “blanket” basis, they have new tools to slice individual exposures by specific rooftop locations. In the example of a flood-prone region, insurers can identify which specific properties are at risk, instead of relying on broad postal code or FSA boundaries.

By assessing risk at the property level, insurers have the ability to underwrite business they may have previously declined, based on an inaccurate assessment of the risk location. With a better understanding of geographical risk (peril and accumulations) insurers can be more aggressive with rates in low-risk areas. Underwriters can identify under-exposed areas and target those areas with marketing efforts and competitive premium. Using a location intelligence capability, the insurer can hone in on a given region’s hot and cold spots

Conclusion 

Location-based technology has become an invaluable strategic tool to many leading insurers. Precise mapping and geocoding allow underwriters to quickly access information, recognize patterns and drill down into data for detailed analysis and sound decision-making. The real danger for those carriers not adopting location intelligence is adverse selection – the writing of poor risks without accurate or detailed information.

Understanding where a property is in relation to risk elements is a key decision affecting an insurance carrier’s profitability. Using location intelligence is a simple solution to a complex, real-world problem for the insurance industry. Insurers depend on geographic and demographic information to assess underwriting risk, develop appropriate pricing models, match coverage, expand markets, serve existing customers and develop new or niche business

To learn more download our Property & Casualty Insurance: Getting Risk Right White Paper

Location Intelligence and Summertime

The productive days of summer?

Many businesses think summer is the time to relax. It’s also a great time to gain a competitive advantage through location intelligence and data insights.

Your summer business strategy may consist of three (3) simple steps to gain that competitive edge:

  1. Look for easy access to data
  2. Ensure comprehensive data selection
  3. Better understand your risk

Look for Easy Access to GIS Data

When looking for risk related data:

  • Confirm the data is available through a web service.  This allows you to integrate information into your current platform such as the Purview AVM data and perils related data.
  • Understand how to obtain the highest match rate between your database and data services. This helps to avoid ambiguous addressing through the use of a unique address identifier (UAID®).

Location Intelligence Success Story

Lenders using DMTI Spatial’s™ Location Hub® platform can search the national Purview web service using the UAID which is assigned to every address for Canada with roof-top precision.

Ensure Comprehensive GIS Data Selection

Teranet partnered together with DMTI Spatial to provide complimentary capabilities to shared clients. This partnership provides clients with a complete view of their data.

Teranet DMTI Spatial
Addresses
Property Ownership Flood
Property Valuation Earthquake
Equity Estimate Crime
Comparable Sales Environmental Risk
Fraud Checks Demographics
House Price Index (HPI) Firmographics

With over 15M addresses in Canada, having access to the most comprehensive risk-based information at the property level allows insurance and finance companies to generate new insights.

Understand Your Risk

With this wealth of location-based information businesses can benefit in the following ways:

  • Understand the risks associated with specific geographical areas and leverage that knowledge to fine-tune pricing
  • Link disparate information for real-time decision making
  • Enhance portfolio analysis across the entire book of business

Summary

Take advantage of the down-time that summer offers. Evaluate your current systems and workflows and explore solutions that provide comprehensive information to help you hit the ground running in the fall.

Learn how location intelligence can help your business by contacting DMTI Spatial.

Calgary Flood

Calgary Flood – 2 years later. Where are we now?

It has been 2 years since the 2013 Calgary floods that occurred in Southern and Central Alberta.  What’s changed?

Overland Flood Insurance Availability

In 2014, Canada’s Economic Action Plan noted that “Canada is the only G-8 country without residential flood insurance coverage, leaving many Canadian homeowners with inadequate protection against losses from overland flood events.”

In 2015, Canadian insurance providers began offering overland water protection for residential property owner across Canada.

Aviva Canada was the first to introduce this change to the market followed shortly after by The Co-operators with Alberta being the immediate focus and other subsequent provinces to be rolled out over time.

 A better understanding of flood risk

According to the Canadian Underwriter:

Flooding is the most common type of natural disaster in Canada and the flood in southern Alberta in 2013 was the most costly storm in Canadian history. “In general,” overland flooding is not currently covered on home insurance policies, the Insurance Bureau of Canada said recently on its website.

A number of vendors have begun to offer hazard maps that help companies determine

The first vendor to market was JBA Risk Management and in May 2015 Aon Benfield began offering this type of data to Canadian insurance companies.

A better understanding of portfolio risk

As the usage of flood hazard maps increases, they will also seek detailed property location information to ensure that they understand where current and new customers are located in reference to these boundaries.

Insurance companies typically utilize three (3) different boundaries from the first three digits of the postal code to the address when analyzing flood risk:

Boundaries Number of unique records in Canada 2015
Forward Sortation Areas (FSA) 1.6K
Postal Codes (FSA LDU) 857K
Addresses 15M

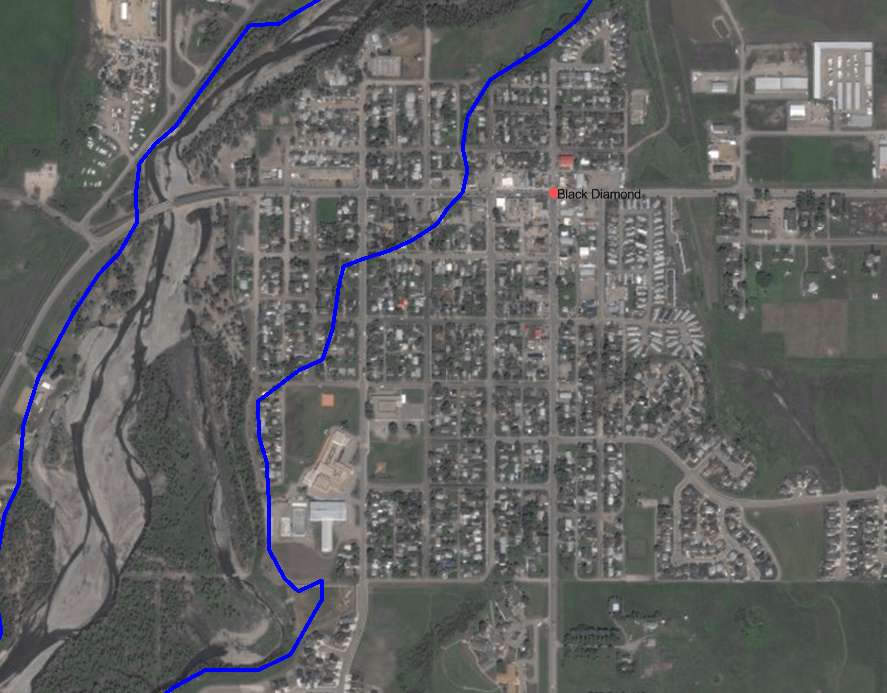
Address level accuracy should be considered when mapping (geocoding) your portfolio against flood hazard boundaries versus the use of postal codes to better understand risk.  Using postal codes without understanding how many individual properties are associated to it in relation an event boundary may lead to the stigmatization of that entire postal code even though only a few addresses may be impacted.

Below is an example for the municipality of Black Diamond, Alberta which has one postal code (T0L0H0) and over 1,000 addresses associated with it. The blue boundary represents the flood boundary from the Alberta 2013 floods.

data visualization tools

The map below depicts the same area where the blue boundary represents the flood boundary from the Alberta 2013 floods:

data visualization tools

Data maintenance is essential to ensuring high-precision accuracy.

Alberta municipalities Number of new addresses added since 2014
Calgary 31,897
High River 281

Address level precision should be utilized when comparing flood information to policies and performing other forms of analyses such as concentration analysis and proximity to other perils such as risk (e.g., underground tanks).

Click the links below to learn more about disaster risk management and disaster visualization tools:

To learn more about how your book of business may be impacted by overland flood in Canada, please contact us.


Disaster risk management in oil spill

Properties, Oil and Water Don’t Mix

Oil and Water Don’t Mix.  That was especially true on Wed April 8, 2015 when a tanker in the English Bay in Vancouver was reported to be leaking fuel into the surrounding waters.

The spill amount was “above the norm” but not “catastrophic.” Local residents were warned to avoid the beaches on both sides of the bay, according to CBC News,

Transport Canada has reported the following major oil spills in western Canada:

  • In 1988, Vancouver Island was affected by a spill from an oil barge that lost approximately 87 tons of oil
  • In 2006, a B.C. ferry sank with 240 tons of oil on board.

Gauging the impact

You can view an event zone on a map and determine exposure quickly by linking impacted addresses to your book of business with DMTI’s Location Hub® Post Event Service. Custom event reports allow you to easily share exposure information across your organization. This ensures swift action and superior customer service.

What is the impact of oil spills on property values?

A report created by the Conversations for Responsible Economic Development (CRED) reveals the following key findings:

  • Both direct contamination & the perception of contamination have clear and well documented impacts
  • In several documented cases, directly impacted properties lost 10-40% of their value
  • The reputational impacts alone are significant – properties nearby spills will usually see a 5-8% reduction in value
  • The most significant impacts are felt in the first year and usually last less than 5 years

Assessing future risk

A proposed pipeline destined to carry more oil to the Westridge terminal in Burnaby, BC would increase the number of tankers traveling through Canadian waters from 5 to 34 per month (Global News).

How can organizations prepare?

  • Connect. Analyze. Act™
    • Seek a solution that provides timely and advanced insight into the duration, size, impact and number of addresses affected by an event. This allows you to easily share exposure information across your organization.
  • National insights in real-time
    • Take advantage of an offering that delivers property level event information and other perils that may impact your book of business.

How can I learn more?


Flood risk

Are Insurance Companies Measuring Flood Risk Accurately?

On Feb 19 2015, Aviva Canada announced the availability of overland water endorsement. This meant homeowner coverage in Ontario and Alberta would start in May, and roll out to additional provinces throughout 2015.

In Canada, we now have national flood hazard maps and the ability to easily map each of our policies.

“What gets measured, gets managed” – Peter Drucker

Data Visualization Tools for Flood Risk

Patrick Lundy (CEO) of Zurich Canada said:

“Having the right tools, maps and predictive models is key to charging an accurate price for the risk, and capacity in certain areas may become harder to come by. Updated flood zone maps for Canada are of the utmost importance in being able to respond accurately to the increased flooding activity.” (Canadian Underwriter, 2013)

Today, insurance organizations have the ability to:

  • Identify and assess significant exposures in their portfolio
  • Identify new business without growing their 1/n year flood loss
  • Determine where they should not write new business
  • Identify flood risk which may require a more detailed assessment

“Opportunities multiply as they are seized” – Sun Tzu

Insurance Bureau of Canada (IBC) identified that overland flooding is a risk, but this is for a small percentage of the population. This refers to those who live in floodplains or flood prone areas close to rivers or lakes.

Leveraging this knowledge may lead to the creation of a new niche product offering for overland flood.

“Once we know something, we find it hard to imagine what it was like not to know it” – Chip & Dan Heath, Authors of Made to Stick, Switch

The Real Flood Risk

Van Bakel of Crawford recalled discussions that insurance companies shouldn’t worry about catastrophic events, and that everything was accounted for internally.

Fast forward about six weeks. Two of the most populated areas of Canada would never flood within two weeks of each other, would they?”

Overland flood hazard maps and precise mapping (or geocoding) technology allows insurance companies to:

  • Understand the risk to your book of business
  • Identify which markets may have flood risk
  • Create new pricing models based on this risk
  • Generate new product revenue for the business

Click here to learn more about how your book of business may be impacted by overland flood in Canada, or contact us at info@dmtispatial.com.


Risk management for earthquakes

The Importance of Managing Earthquake Risk

Do your risk management processes consider the risk of Earthquake?

October 16th marked the 7th annual ShakeOut where over 24 million participants worldwide will practice how to drop, cover and hold on at 10:16 a.m. during Great ShakeOut Earthquake Drills.

“ShakeOut BC Day” started in 2011 and this year over 660,000 participants in British Columbia will participate in drills.  The Charlevoix region in Quebec started participating in 2013 and the entire province has joined in for 2014 with over 80,000 participants registered.

Canadian Regions at Risk for Earthquake

Most people would initially think that British Columbia is most at risk when thinking about the risk of earthquakes in Canada.  However, parts of Quebec and Eastern Ontario are also at risk for earthquakes.  At a recent earthquake response seminar held in Toronto by the Catastrophe Response Unit (CRU), Dr. Kristy Tiampo, professor of geophysical modeling methods at Western University’s department of earth sciences in London, Ont. who also works with the Institute for Catastrophic Loss Reduction (ICLR) stated that “Montreal and Ottawa are both at significant risk of ground shaking” and noted that both cities have seen earthquakes that have measured around 6 on the Richter scale.

In an October 2013 report commissioned by the Insurance Bureau of Canada titled “Study of Impact and the Insurance and Economic Cost of a Major Earthquake in British Columbia and Ontario/Québec” two hypothetical earthquakes were modeled by AIR Worldwide.  One off the west coast of British Columbia measuring 9.0 on the Richter scale and one northeast of Quebec City measuring 7.1.  These two hypothetical scenarios would result in a combined estimated total insured losses of over $30 billion.

It is imperative for insurance companies to have a complete and accurate picture of the location of the property that they are insuring in context to the risks that surround that property.  This will allow them to rate the policy correctly and also to determine whether or not they want to assume the risk.  Understanding where the property is in relation to an earthquake zone is very important.  But not only is it important to know if the property itself is at risk, but also knowing where that property is in relation to other items that could be impacted by an earthquake.  For example, what if the property was close to a natural gas pipeline or propane processing facility?  Knowing about these potential risks in isolation is important to the underwriting and rating decision. But, what about when you also factor in earthquake?  An earthquake of a small magnitude may not be enough to cause much damage the property.  But what if it was enough to cause a gas leak, that then lead to a fire and an explosion?  Having this level of information could mean a big difference.

Disaster Risk Management for Insurance Companies

Another factor to consider for insurance companies is the accumulation of risk.  While the risk for the single property may be acceptable, knowing where all your existing policyholders are at the time you underwrite a mortgage and their relation to risks such as earthquake zones will be critical in determining whether you are willing to assume this additional risk or if your exposure is too high.  If there are two major events in a given year, would your exposure be too high and you wouldn’t be able to pay out on all the claims?

In Canada, various forms of location such as postal code boundaries, municipalities and Catastrophe Risk Evaluating and Standardizing Target Accumulations (CRESTA) zones (for earthquakes) are used to determine the accumulation of risk.

As per the ICLR, Canadian reinsurers, insurers and regulators use Catastrophe Risk Evaluating and Standardizing Target Accumulations (CRESTA) zones as the minimum standard for the capture of data and first level of calculation of probable maximum loss (PML).  PML evaluations can influence underwriting decisions, and the amount of reinsurance allowed on a risk can be predicated on the PML valuation.

The original CRESTA zones were established in 1981 and introduced in Canada in 1986.  They have been recently re-worked globally and have been re-launched to the market for 2012/2013.

All businesses can use this information to help define their contingency plans in event of an earthquake. Which of my existing store or branch locations might be impacted?  Where are my employees situated?  How would I deploy resources to help my customers most efficiently?  Where would I situate them?Insurance underwriting and exposure analysis is only one area where this information can be used.  Other examples include:

  • Public Safety departments within governments can use this to build contingency plans for their citizens, determine where they would locate remote relief sites, sites for temporary housing or medical facilities.
  • Telecommunication companies could use this to gain a better understanding of the risks associated with building out infrastructure in various parts of the country

Click here to see how DMTI’s disaster risk management tools help insurance companies effectively plan for every possibility.

Canadian Flood Data

Are ‘inadequate’ flood-hazard maps impacting your business?

The flood-hazard maps currently available for Calgary are inadequate, according to a recent Calgary Herald article.  Hundreds of properties outside of the designated 1/100 year flood plain were impacted during the Alberta flood event of 2013.  Canada experienced the costliest and third-costliest disasters in Canadian history within two weeks of each other in 2013.  This past summer has also seen its share of flooding. The Insurance Bureau of Canada (IBC) estimated insured damage from summer flooding in the Prairies at $60 million.

The Institute for Catastrophic Loss Reduction (ICLR) advocates for the implementation of the recommendations made from the Alberta provincial reportProvincial Flood Mitigation Report: Consultation and Recommendation.”  Flood risk maps are needed to identify urban flood risk areas.

Effective Disaster Risk Management for Insurance Companies

Disaster risk management is crucial. The following for flood-hazard maps should be considered, in addition to the recommendations above:

  • Use multiple flood-hazard return periods (1/20, 1/100, 1/200 and 1/1,500 year) for analysis
  • Ensure flood-hazard data is regularly assessed and maintained annually
  • Integrate flood-hazard data and location services into your on-line underwriting applications to get real-time access to proximity to flood and water features
  • Access address level services that provide risk related information
  • Assess your accumulated risk based on location of properties within the 1/20, 1/100, 1/200 and 1/1,500 year flood zones.

What about flood maps for Canada?

A national file of flood-hazard maps for Canada will allow you to understand the risk associated with one address or your entire portfolio.

For insurers, this data allows you to get the answers to imperative questions such as:

  • Exposures to your portfolio
  • Where to write new business without growing your 1/n year flood loss
  • Accurately rate policies based on the potential risk of flood
  • Where not to write new business
  • Identifying areas that may have a potential flood risk that may require further assessment

Learn more about how to take advantage of vital flood information that can be used in real-time transactional risk analysis. Click here to learn more about how DMTI provides Insurance Providers with accurate information.

Canadian Flood Data

DMTI helps First Calgary Financial during the Alberta flood crisis

Well-timed delivery of data from DMTI Spatial helped First Calgary Financial take better care of its members

DMTI Spatial published the following piece on the work done with First Calgary Financial in assisting them to take better care of its members during the Alberta flood crisis. 

“With the help of DMTI, we were able to identify members living within the flood areas, identify the potential financial impact created by the flood and make quick and impactful member response decisions with complete understanding of the financial implications ”, stated by John Dundas, Senior Vice President, Strategy and Operations at First Calgary Financial.  Read More