Mexico Business Directory Data

Doing Business In Mexico: The Largest And Only Location-Based Mexico Business Dataset

Doing business in Mexico?

Growth-minded companies are increasingly investing in and marketing to businesses in Mexico. This emerging market offers huge potential with a stable economy and currency, a growing middle class, skilled workforce, and low cost of manufacturing. Plus, free trade agreements offer favorable incentives, making it easier to do business in Mexico than in many other countries.

If you’re looking to invest resources in Mexico, you need reliable and accurate information to ensure that your decisions support current business objectives. Knowledge is your greatest asset when doing business in Mexico and location-based data should be central to your research as you look into the assets and resources that will help your business grow.

Leveraging location-based data will help you uncover reliable partners, opportunities, and most importantly, provide the knowledge you need to support your decisions.

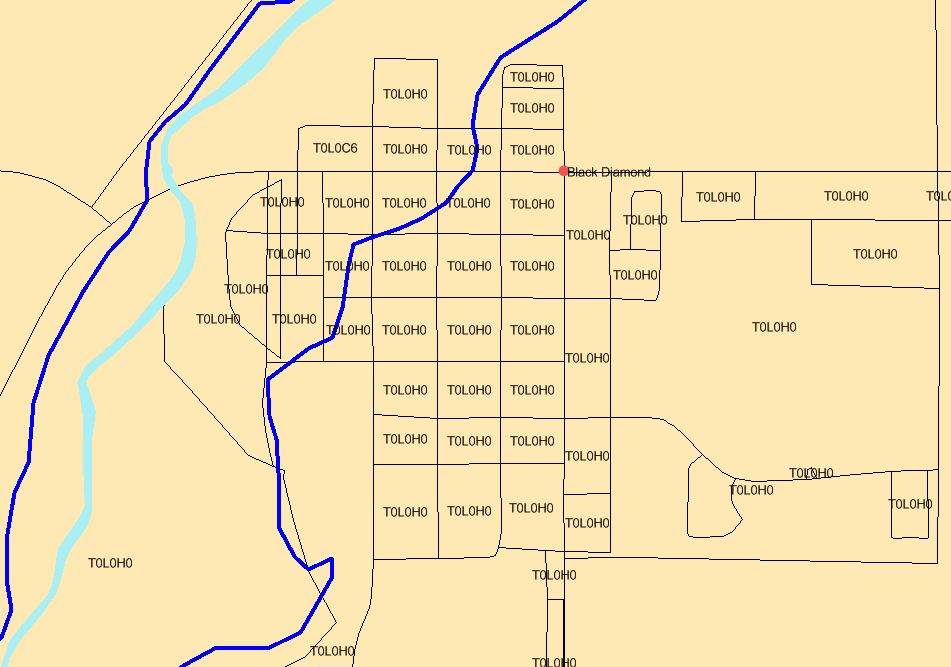
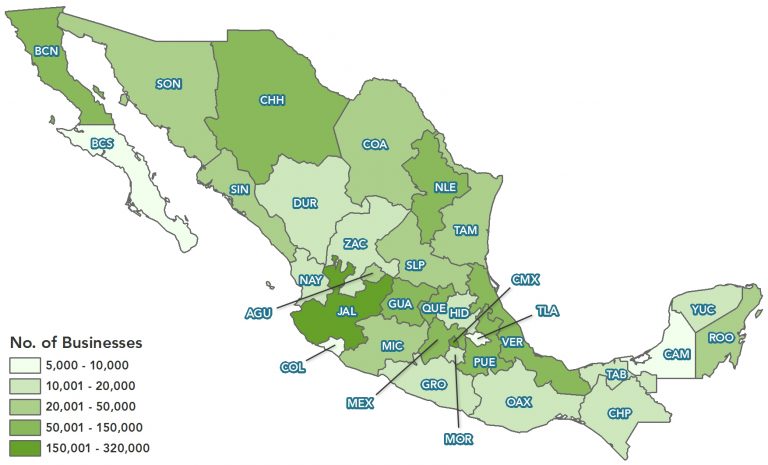
See the map below to understand our coverage by state:

What is Location-Based Data?

First, an explanation of exactly what location-based data is and why it’s important. Also known as ‘location intelligence,’ location-based data displays information layered onto a map. It shows how various points of information spatially relate to each other, helping to support analysis and decision making.

Maps bring information to life, allowing you to understand information and relationships geographically, and uncover valuable insights.

How Location-Based Data Helps You When Doing Business in Mexico

Growing any business involves risk and reward. Risk increases when expanding into a new market. Foreign competition in Mexico is growing as more businesses recognize the advantages of doing business there. This means you need to identify the best opportunities quickly and act on them as soon as possible. Making effective decisions begins with leveraging accurate location-based data.

Once you’ve evaluated your needs, you need to do research and analysis to support your objectives. Location-based data allows you to get very familiar with target geographies or industries, helping you to find the most cost-effective dataset.
For example, if you’re looking for people and companies you want to do business with, here’s a summary of the data fields available:

  • Industry Sector
  • Major SIC Category (2 Digit)
  • Sub SIC Category (4 Digit)
  • Product or Service Description
  • Company Name, Address, Colonia, City, State, Zip/Postal Code

Also, our location-based data can be delivered as a complete dataset or as a subset. Here are our most popular subsets:

  • Point of Interest (POI) Dataset
  • Mexico Manufacturers Dataset
  • Mexico Email Dataset
  • Mexico Importers and Exporters Dataset
  • Mexico Wholesalers & Distributors Dataset
  • Mexico Retailers Dataset
  • Mexico Head Office Dataset

Additionally, if you need a subset of businesses located near an airport or other transportation hubs, contact us. If you need a subset of businesses located near a particular distribution center or closer to an agricultural area, all of this information is easier to see and understand when it’s on a map.

Doing Business In Mexico: Use Data to Save Costs and Drive Revenue

Instant access to Mexico business data will improve your potential for expansion and growth. It will help you determine the best options for cost-effective solutions, as well as identify how you can mitigate risk. For example, accurate location data helps your company identify the best locations for doing business, and the best people and companies within those locations that will help your company realize its objectives.

You’ll be able to make effective decisions faster than your competitors with the right location data, helping you to meet the growing demands of your business and facilitate growth. However, that data needs to be accurate and timely to positively impact business outcomes. When seeking business opportunities in Mexico, location data needs to be flexible, allowing you to filter and manipulate data so that you can analyze it according to your specific business needs.

The Largest Source of Location-Based Mexico Business Data

Accessing location data in large countries can be a major challenge. Many businesses come across unexpected obstacles to accessing the information they need, including bureaucratic issues, and cultural and language barriers. Once information is found, it’s difficult to determine if it’s accurate and reliable. To maximize your use of the data, you need to ensure that it’s accurate, continually updated, and will flow freely into your hands when you need it.

For companies looking to grow in Mexico, Digital Map Products offers the largest and only location-enabled dataset for Mexico business data. Contact us to learn about available data and pricing.

Want to see a sample of the data and how it’s structured?

Click here to download a sample dataset.

mapping condo concentration

3 Reasons Why Mapping Condo Concentration Matters

The construction rate of multi-family dwellings in Canada shows record highs being posted in the last 5 years. This presents some unique challenges when analyzing data sets. Multiple units can exist within a single address, an important consideration when mapping and developing your analysis.

Let’s review 3 potential issues and what to do about them.

Mapping multifamily construction

The Impact on Infrastructure

Condos require services, meaning they will draw heavily on existing infrastructure. The Ministry of Government and Consumer Services, for example, commissioned a report on elevator availability and maintenance. The request for proposal, which was issued by the Technical Standards and Safety Authority states “Ontario is currently experiencing one of the largest construction booms in residential properties in North America (and) a rapid growth in the number of elevators.”

High-rise construction requires specific planning of services, as higher densities can break traditional models that are based on regional boundaries. The ability to sketch out the density caused by high rise building enables analysts to better define territories in modelling out future service requirements.

Book of Business Modelling

Over 109,000 condo units were added to the downtown Toronto market since 2010. Insurers have an ever increasing need to model their current and prospective business against the current condominium market. This will ensure they are not over or under represented in certain buildings.  This can be challenging for any new building to ensure proper targeting of new business and ensure current business are not overrepresented.

The following graphic shows the state of condominium builds since 2010 in the city of Toronto – note the variability in the number of units in each area – and the resulting impact on any book of business.

Toronto's five decades of condo growth, mapped

Marketing to Highly Profitable Clients

The opportunity for utility and telco to maximize profitability is high in the condominium and multi-family dwelling market.  You’ll be able to bring services to a high number of users with minimal expense. It does, however, require marketers to target end users accurately and understand who is within reach.

This is an opportunity that plays out across major markets throughout Canada.  The following chart shows the expectation of continued higher production of multi-family starts vs. single-detached for the city of Calgary.

CMHC Forecast-Summary

Marketers and operations managers have an excellent opportunity to combine their current client data with accurate location intelligence data. This will help them understand where new, profitable business opportunities are emerging across the country.

Check out the new DMTI / Teranet Condo Concentration Insights offering here if any of these business scenarios apply to you.

Here are helpful links if you are looking for Mexico Business Data, U.S. Real Estate Tools or U.S. GIS Mapping Technology

Data visualization for government

When a whole city changes…

Providing the best data visualization products for Canada means investing in the best sources of information possible. Streetfiles, postal codes and address points are key layers and must be accurate.

DMTI’s Data Visualization Tools

DMTI identifies areas to work on ranging from new subdivisions to urbanizing rural areas. Typically, the number of changes per area ranges from a few to a few hundred.

Our team occasionally encounters a scenario where a municipality has changed so much that it appears completely different. Everything is affected — from the street name to the postal codes that provide mail to their residents and businesses.

The Case of Shawinigan, QC.

Shawinigan is a city located on the Saint-Maurice River in the Mauricie area in Quebec, Canada. The population is 50,060 as of the Canada 2011 Census as per Wikipedia and 26,230 private dwellings occupied by usual residents.

As part of our focus on Canada, we are continually updating and comparing three (3) main sources of information. This includes  streets, postal codes and addresses.

Our data team compared the latest Canada Post data against the current database. We found that Shawinigan, QC – many addresses suddenly fell out due to changes.

An investigation revealed the area recently changed most of their addresses, and was planning to change more.  The Canada Post data was actually showing only about half of the changes. Nearly the whole area would be affected!

We compared this finding against additional sources to fact check the changes. Our team made the city-wide changes to our data as soon as possible.

The result was some Canada Post fallout within the product. But this allowed us to deliver greater accuracy and stay aligned with the changes.

Due to the scope of the changes (an entire municipality!) – the entire data team banded together and got this update into our upcoming Aug 2016.3 data release because of how important it is to ensure our products are in alignment.

Congratulations Data Team, and thank you for your on-going commitment to data quality and currency and all of the other changes that went into this release!

Click here to learn more about how DMTI Spatial delivers complete accuracy, helping businesses get ahead of the competition.

Location Intelligence and Summertime

The productive days of summer?

Many businesses think summer is the time to relax. It’s also a great time to gain a competitive advantage through location intelligence and data insights.

Your summer business strategy may consist of three (3) simple steps to gain that competitive edge:

  1. Look for easy access to data
  2. Ensure comprehensive data selection
  3. Better understand your risk

Look for Easy Access to GIS Data

When looking for risk related data:

  • Confirm the data is available through a web service.  This allows you to integrate information into your current platform such as the Purview AVM data and perils related data.
  • Understand how to obtain the highest match rate between your database and data services. This helps to avoid ambiguous addressing through the use of a unique address identifier (UAID®).

Location Intelligence Success Story

Lenders using DMTI Spatial’s™ Location Hub® platform can search the national Purview web service using the UAID which is assigned to every address for Canada with roof-top precision.

Ensure Comprehensive GIS Data Selection

Teranet partnered together with DMTI Spatial to provide complimentary capabilities to shared clients. This partnership provides clients with a complete view of their data.

Teranet DMTI Spatial
Addresses
Property Ownership Flood
Property Valuation Earthquake
Equity Estimate Crime
Comparable Sales Environmental Risk
Fraud Checks Demographics
House Price Index (HPI) Firmographics

With over 15M addresses in Canada, having access to the most comprehensive risk-based information at the property level allows insurance and finance companies to generate new insights.

Understand Your Risk

With this wealth of location-based information businesses can benefit in the following ways:

  • Understand the risks associated with specific geographical areas and leverage that knowledge to fine-tune pricing
  • Link disparate information for real-time decision making
  • Enhance portfolio analysis across the entire book of business

Summary

Take advantage of the down-time that summer offers. Evaluate your current systems and workflows and explore solutions that provide comprehensive information to help you hit the ground running in the fall.

Learn how location intelligence can help your business by contacting DMTI Spatial.

GIS Mapping Software

A Lesson in Map-Folding Origami

Do you use maps? I’m fairly certain you do, possibly a GIS mapping app on a daily basis. When I was 16 and learning to drive maps were these sticky, dirty, impossible to fold, gigantic pieces of paper I always managed to rip while shoving back into the glove box. “You be the navigator, I’ll be the driver.” Remember those days?

Today we don’t have to worry about map origami (seriously, who actually folded it right the first time?!). I personally have 2 mapping apps on my Android, both of which have totally different purposes.

GIS Mapping Apps in order of favouritism:

1) Waze – Hands down one of the most fun and accurate traffic applications out there. Excellent UI and hilariously fun Voice Navigation, (I highly encourage everyone to try “Boy Band”). This app is intended to effortlessly navigate you through high traffic and accident-prone areas. Definitely my choice of app when it comes to getting from A to B.

2) Google Maps – With over 4.8 million Android users alone, this application is well known for its pros and cons. While it is definitely the easiest application to operate, it nearly never locates my gps position in under 5 minutes. This is my app of choice when looking up an area or trying to find a specific address.

You will notice these apps are very centered around my inability to navigate when driving, or using transit. How else would I use maps as a consumer?

Here’s Why the Average Person Needs a GIS Mapping App:

  • Get me from Home to ‘X’
  • Get me from Work to ‘X’
  • Find me the closest Subway to ‘X’

Pretty simple isn’t it? Not if you’re a Business.

Using GIS Mapping Software in the Business World

Maps in the business world are complex. Heck, that’s why we have GIS mapping apps. As this Esri link tells us, nearly every business benefits from understanding their environment. Better decision making, cost savings, etc. Whether you are in Retail, Land Development, or Health Care, it matters to know where your Customers/Clients are located. Better yet, if you have a GIS professional on your team – they can build you a map!

Take Health Care for example. DMTI Spatial worked with the Ontario Medical Association to understand where their Physicians were located in relation to the population in Ontario. While this exercise sounds easy, it was a complex project that resulted in a table of over 142 billion records – one of the largest data deliveries in DMTI’s 20 year history. Where your Customers are located matters.

Now consider Retail. What if you found out your most loyal customers (aka the ones that spend the big bucks) are located within 10 km of your store. Would you consider marketing to these neighbourhoods? Or divert marketing dollars that were intended for a 30km + distribution?

Today we use maps to make business decisions. Only these maps are digital, and sometimes come with a boy band singsong voiceover (again, I highly suggest it).

Want to integrate a basic map into your Business process? Want to visualize where your customers are? Let me know and I can help. But, I can’t fold that blasted paper map back up for you.

From Data Analytics to the Cloud

Top Finance Execs Discuss Industry Hot Topics

In an increasingly digitized world, data carries undeniable clout. At once the source of insight into optimizing business operations, data analytics also supports the development of products and services that were unimagined before as new sources of social and sensor information – and the technology to manage it – come online.

But if the vision for data potential is coming into sharper focus, for many organizations, the actual integration of new volumes and variety of data to create business value is less clear. In this situation, the sharing of experiences with data successes and ongoing challenge can serve as a useful tool to galvanize discussion and ultimately more successful deployment of data and analytics solutions. Within a specific industry, this sharing can take on added import as common language and circumstance create quick sympathy – a phenomenon demonstrated in the June installment of DMTI Spatial’s Strategic Insights Sessions, at which key players in the financial sector considered top of mind issues in the use of analytics in banking and insurance.

Data Analytics in Finance

To kick off this month’s pre-game session at the Rogers Centre in Toronto, DMTI invited four panelists to outline their involvement with different analytics projects. These presentations provided a springboard for session attendees to discuss their own knowledge and experience of data practices. Like the topics covered in the panel presentations, conversation in post-panel breakout sessions was animated and broadly based. Several key themes arose in the panel, breakouts and Q&A segments, however, that reveal much about the current state of data analytics adoption.

Finance Industry Discusses Data Analytics

Analytics-based customer experience vs. privacy

In her presentation, Susan Doniz, global chief information officer for provider of marketing and loyalty analytics solutions Aimia, lead with the notion of ‘customer experience’, a buzz topic in the industry that is an increasing preoccupation of customer facing organizations that are on the cutting edge of service delivery.

According to Doniz, loyalty programs based on sophisticated analytics can help businesses understand the consumer, but the key is to use data to do things for people rather than for the business alone. She provided a couple of examples – UK-based grocer Sainsbury, which analyzed what people were buying to discover who might be prone to heart conditions and hence improve targeting for medication and wellness marketing campaigns, and Sephora, which developed “Inform” analytics to remind customers what they had bought in the past to ease the shopping experience – in order to introduce issues around this practice of ‘personalization’.

While personal information can inform service delivery, Doniz argued that consumers today also want transparency around how their data is being used, the ability to turn the data flow off, as well as information on who has accessed their personal data. Largely a government responsibility, the privacy of personal data is also a challenge for CIOs, she argued, who typically do not have a lot of experience in this area. What kinds of limits should be placed on information sharing, what is necessary to collect and what institutions do consumers trust with information like a “digital ID” are all questions that still need to be resolved.

Cloud a panacea for Big Data requirements?

CFO for Kognitive Marketing Atif Ansari made a strong case for creating customer experience through the use of cloud computing, illustrating the benefits of this data delivery approach through description of his work with Bank of America. Ansari asked: “performance measurement takes a long time…. how do you simplify it, [and move data from back office systems] so that it serves the front office who can use it to better serve customers”?

Since bank transactions are typically managed on a quarterly basis, Ansari explained that traditionally it has been necessary to build huge computing systems that were not attuned to this kind of schedule, but could provide capacity when demand was at peak. While this practice is common, it is extremely costly. As a result, the bank moved to cloud, dramatically reducing the costs associated with data housing and management (savings in the millions Ansari added), while also delivering instant access to data for field workers. The financial investment advisor, for example, who is now able to access cloud data to show the customer everything about his individual portfolio in real time in the field.

Ansari acknowledged security and data residency concerns around cloud technology that linger in this sector, but argued that now that service providers can delivery virtual private cloud, located in Canada, there is increasing adoption of cloud within the financial services industry. Ansari’s perspective on cloud was not universal, however, and other session attendees voiced more reservation. For example, Curtis Gergley-Garner, chief risk officer at Canada Guaranty Mortgage Insurance Co., noted that cloud tends to be problematic at his organization since it works with bank data, and the banks in turn require that Canada Guaranty systems be as robust as their own: banks need to become comfortable with cloud data first, before insurers take this step, he insisted.

Similarly, Dion Yungblut, VP at Capital One, observed that while people are moving to cloud, the banks and regulators are not really there; a leader’s job, he said, involves understanding how stay on top of that – how to take advantage of “exponential growth of access to data and computing” and to to create “nimble IT infrastructure” if cloud is not ubiquitous. To clarify, Brad Struthers, director of collateral management and strategic alliances at RBC, pointed to the importance in this debate of separating out cloud computing and cloud storage, which may have different security management requirements. Lack of understanding issues like this, he added, may be preventing banking organizations from tapping into new technologies.

Tech for operational efficiencies

David Bradshaw’s data story was one of growth management. As the VP, client business support at Tangerine bank, explained, the Tangerine group predicted their transactional volume was going to grow by 48 percent with ramp up of operations, and built a “scalability model” based on Excel spreadsheets to figure out how to prevent operating costs from growing at the same rate. This model helped Tangerine to identify the areas that were going to expand most quickly, and which would benefit most from process optimization. Areas such as deposits, where manual management of fuzzy screen cheque photos proved a real bottleneck, as did the mailroom, mortgages and payments.

Through this analytics exercise, the organization was also able to estimate the potential savings that could be gained via the replacement of manual processes with technology, and to plug tools in to achieve significant improvements in focus areas like the mailroom. By streamlining processes and identifying the proper software tools to help increase operational efficiency and speed time to market, Tangerine managed to increase volumes by 45 percent with no increase in operating costs.

Fill in the right data blanks

Curtis Gergley-Garner from Canada Guaranty launched his presentation with the observation that as a relatively new company in the mortgage insurance space with two very large competitors that have a lot more data than they do, the firm has to be very efficient with the data they do have.

From a business perspective, the goal of Canada Guaranty’s data strategy was to improve the efficiency, consistency and speed with which mortgage applications are approved, decrease the cancellation rate (as frustrated customers look elsewhere), improve customer service, ultimately, the overall quality of Canada Guaranty credit. To achieve this, the firm mounted in two specific data projects. One involved the creation of a proprietary scorecard, based on trended credit bureau information over five quarters, which enhanced the company’s ability to predict forward default. On the property side, Canada Guaranty also worked with DMTI Spatial to implement the Location Hub platform, which addresses problems with ambiguous addressing through the Unique Address Identifier (UAID) standard, and by analysing the address quality in a customer data set based on automated error checking.

As Gergley-Garner explained, when individuals input address data, it’s not uncommon for errors to occur; by the same token, it is difficult to achieve an “automated value model” when address data is wrong and easy to “miss a lot of hits” in address search.

The importance of data cleansing, data integrity and completeness of the data set – in location information and other areas – to the implementation of solutions that can support business objectives was echoed by other session participants. Noting regulators’ move from structured data models to real time analytics models, Parag Gupta of the Northbridge Financial Corporation asked “How can you clean up their data?” and “what kind of problem does this cause for the insurance business?” Pointing to the fact that it’s typical for an organization to have lots of data in one area, and shortages in others, Brad Struthers from RBC asked “how is it possible to fill in the gaps?”

If no definitive answers to these data quality issues or to questions that linger around privacy and the use of cloud emerged at the session, by drawing together individuals with similar industry experience who ask the right questions, DMTI hosts are helping to shape an ongoing and healthy dialogue on best practice in the use of financial data and analytics.

Contact us to learn more.

Calgary Flood

Calgary Flood – 2 years later. Where are we now?

It has been 2 years since the 2013 Calgary floods that occurred in Southern and Central Alberta.  What’s changed?

Overland Flood Insurance Availability

In 2014, Canada’s Economic Action Plan noted that “Canada is the only G-8 country without residential flood insurance coverage, leaving many Canadian homeowners with inadequate protection against losses from overland flood events.”

In 2015, Canadian insurance providers began offering overland water protection for residential property owner across Canada.

Aviva Canada was the first to introduce this change to the market followed shortly after by The Co-operators with Alberta being the immediate focus and other subsequent provinces to be rolled out over time.

 A better understanding of flood risk

According to the Canadian Underwriter:

Flooding is the most common type of natural disaster in Canada and the flood in southern Alberta in 2013 was the most costly storm in Canadian history. “In general,” overland flooding is not currently covered on home insurance policies, the Insurance Bureau of Canada said recently on its website.

A number of vendors have begun to offer hazard maps that help companies determine

The first vendor to market was JBA Risk Management and in May 2015 Aon Benfield began offering this type of data to Canadian insurance companies.

A better understanding of portfolio risk

As the usage of flood hazard maps increases, they will also seek detailed property location information to ensure that they understand where current and new customers are located in reference to these boundaries.

Insurance companies typically utilize three (3) different boundaries from the first three digits of the postal code to the address when analyzing flood risk:

Boundaries Number of unique records in Canada 2015
Forward Sortation Areas (FSA) 1.6K
Postal Codes (FSA LDU) 857K
Addresses 15M

Address level accuracy should be considered when mapping (geocoding) your portfolio against flood hazard boundaries versus the use of postal codes to better understand risk.  Using postal codes without understanding how many individual properties are associated to it in relation an event boundary may lead to the stigmatization of that entire postal code even though only a few addresses may be impacted.

Below is an example for the municipality of Black Diamond, Alberta which has one postal code (T0L0H0) and over 1,000 addresses associated with it. The blue boundary represents the flood boundary from the Alberta 2013 floods.

data visualization tools

The map below depicts the same area where the blue boundary represents the flood boundary from the Alberta 2013 floods:

data visualization tools

Data maintenance is essential to ensuring high-precision accuracy.

Alberta municipalities Number of new addresses added since 2014
Calgary 31,897
High River 281

Address level precision should be utilized when comparing flood information to policies and performing other forms of analyses such as concentration analysis and proximity to other perils such as risk (e.g., underground tanks).

Click the links below to learn more about disaster risk management and disaster visualization tools:

To learn more about how your book of business may be impacted by overland flood in Canada, please contact us.


Using data to find your ideal customer

How well do you really know your customers?

“They don’t know that we know that they know we know!” – Phoebe Buffay

What do you know? About your customers that is.

Most likely you have assumptions and these assumptions are often backed by data. Perhaps a survey that was conducted a few years ago, or through your experience with your clients first hand. Regardless of how you have acquired this intel, what you think you know about your customers is what should drive your business. But does it?

Effective Market Analysis to Target Your Ideal Customer

Who is your ideal customer? Your absolutely worst customer? Who would you be lucky to nab this quarter? Who could be your Lighthouse Customer?

These questions swim around every Marketer’s, Sale’s and Product Manager’s brain when building new marketing campaigns or planning new sales initiatives. The reality is, we think we have a good idea but may not have enough data to back it up.

Try googling “Ideal Customer”. A lot of businesses think they know the secret formula, but it should be you who determines who is ideal for your business.

Ask yourself these questions:

  • Who do I want to be partnered with?
  • Will I take any customer? Or do I want to portray a branded image?
  • Do I want to grow my business from the outside-in?
  • Does my database contain updated and accurate information about my customers?

Once you have begun to identify who your target customer should be, let the data tell you otherwise. From our experience at DMTI Spatial™ the data often surprises our clients. Most are unaware their database contains inaccurate and outdated data. Often times CRM’s are not kept up to date when employee attrition or customer churn takes place. Your data is what drives your business, not the other way around.

Using the Right Technology for Customer Insights

Need help cleaning this mess up? Start with the basics. Cleanse your address database. Then, ensure your customer records are up to date. Are you customers current? If not, when did they leave?

Once you’ve done this, enrich the data with as much information as possible. What campaigns went out to these customers? When did we reach out to them last? Start with the basics and build a rich repository of data.

Your data is what makes your business unique. Leverage and exploit this well of information to determine who your actual ideal customer is.

Need help? That is where Location Hub® Analytics comes in.

To learn more about how location analytics can help your business, shoot us an email or give us a call at 1.877.477.3684 .

Predictive Analytics Data

Gone fishin’… in a data lake? Predictive Analytics Launch!

Our new Predictive Analytics product launches in less than 2 weeks! As we approach this exciting milestone, we anxiously anticipate the loud ‘splash’ when LEADS (the codename for the product) finally hits the market. I use splash somewhat literally and quite purposefully, as we reside in the era of the “data lake.”

What is a Data Lake?

 The buzz term data lake is progressively used to describe “a state in which all data resides in one environment and can be explored and interpreted without imposing a schema”. Martin Willcox of Teradata eloquently describes the data lake as promoting three big ideas:

  1. Captures data in a centralized Hadoop-based repository
  2. Stores data in a raw form
  3. Enables the breakdown of barriers that inhibit analytics

Picture yourself fishing in a small canoe in a vast open body of peaceful water. As you peer over the side of the canoe you can see clearly beneath the surface into a limitless sea. Within the waters you can see hundreds, if not thousands, of fish swimming carefree. Each fish is a different color and each fish carelessly brushes against your line. As each fish passes your fishing rod tremors, but it is not until the right fish decides to take the bait that you begin the experience of fighting for your prize.

New Insights are Coming from DMTI

Welcome to the data lake. Each fish is a new variable or piece of data you may or may not have seen before. This intelligence you have been exposed to will allow you to gain the valuable insight from a sea of information that is seemingly too difficult or disparate to collect yourself.

This is what LEADS will do. Stay Tuned!

Click here to see DMTI’s GIS Mapping software solution.